Two Black Gapping Candlestick Pattern – Meaning, Formation, Trading & more
Last Updated Date: Nov 16, 2022Candlestick patterns are used by traders to understand the price movement and predict future trends with ease.
Several patterns can be easily spotted and used even by beginner traders. This article features the information on the Two Black Gapping Candlestick Pattern.
Different patterns can be observed in different kinds of markets. However, the markets are always uncertain, and no pattern can be 100% accurate.
About Two Black Gapping Candlestick Pattern
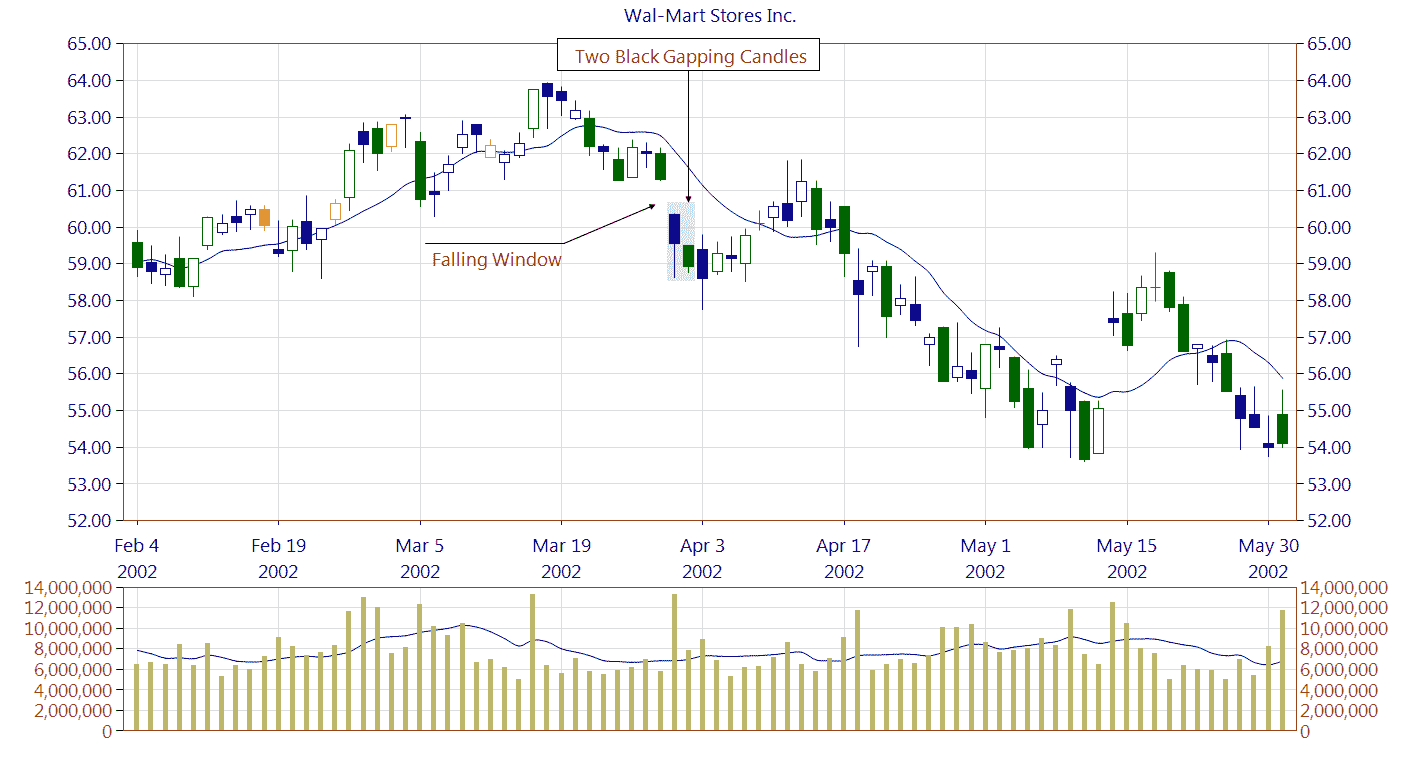
The pattern derives its name from the color of bearish trend candles in the traditional meta trade platform.
In this, the black candles symbolized the selling pressure and the downward price movement. Hence, the Two gapping candlestick pattern depicts a bearish trend continuation.
There are two consecutive black/ red candles in this pattern, prior by a gap down price movement.
Features of the Two black gapping Pattern are
- Both the candles are black
- The pattern signals trend continuation
- There is a gap down
- Occurs during a downtrend
- Candles should not be a Doji
Open Demat Account in 10 Min & Start Trading Now!
Formation of Two Black Gapping Candlestick Pattern
As the name suggests, this pattern is formed by two bearish candlesticks. The first candlestick opens the gap down, i.e., below the close of the previous candle.
The second bearish candlestick in this pattern opens below the open of the previous candle and closes below the close of the previous candle.
To understand the formation better, let us assume the following hypothetical prices:
Suppose the candle closes at INR 430 on 1/10/2020. The next day there is a gap down opening at INR 420.
This first candle closes at INR 400. The following day, again, there is a downward price movement to be observed. The candle opens at INR 410 and closes at INR 389.
To confirm this pattern, the next candle to be formed should also be lower than the second candlestick. This can be called the breakout candlestick.
All of these together would indicate the continuation of the bearish trend in the market.
Know about other major Candlestick Patterns
How to trade using Two Black Gapping Candlestick Chart?
In order to profit from a pattern, spotting it on a chart is not enough. One needs to know how to trade during that pattern and what positions will help in profit maximization.
A careful analysis of the pattern also tells about the safest entry and exit points. Below are the steps to be used to observe and utilize the two black gapping candlestick pattern:
Identification of a Downtrend
The two black gapping candlestick pattern shows the bearish trend continuation. So the first thing to be observed is a downtrend. To observe a downtrend, carefully analyze the price action.
If lower lows and lower highs are being formed on the chart, it can be concluded that there is a downtrend.
Unless there is a confirmation about the bearish trend, there is no point in spotting the two black gapping candlestick patterns.
Spot the Pattern
Now that you are sure that the stock is showing a downward price movement, now is the time to spot the two black candlesticks.
The first candlestick is formed gap down from the previous close. This means the first candlestick’s open price is lower than the close price of the previous one.
The second candle in this pattern opens lower than the opening price of the first. It also closes below the closing price of the first candle.
These two bearish candlesticks can be any Japanese candlestick, except the Doji.
Confirming the continuation of Bearish Trend
The markets can be unpredictable and uncertain often. Just by observing two continuous black candlesticks, you cannot be sure of a downtrend.
In many cases, the prices may start moving upwards. So, before taking a position, it is crucial to confirm the continuation of a downtrend in the price movements.
To confirm the downtrend continuation, the following can be used:
- Volume indicators like volume RSI, Chaikin Money Flow, Money flow index, Volume price trend indicator
- Price action
The downtrend is confirmed when either or both of these conditions are met:
- The candlestick formed immediately after the second black candle is also bearish. An increase in the volume must accompany the next formed candle. You can be sure of the increase in volume by making use of the volume indicators mentioned above.
- The candle formed after the second black candle is also bearish. To confirm the trend continuation, this next candle must close below the low of the previous candlestick.
If either of these conditions is fulfilled, you can be confident that there is a downtrend that will be continued, and you can then assume positions accordingly.
Assuming a Safe Short Position
Once you are sure that the price will move downward, you can take a selling position in the market. However, you should not rely 100% on the pattern.
There is still a high chance of any reversals, and this might cause you huge losses To safeguard yourself from these losses, you need to put a strict stop loss.
If the trade continues to go in your favor, you can keep trailing the Stop loss and book profits as per your greed.
Initially, your stop loss should be above the candlestick’s high price, which you used for the confirmation of the trend continuation.
To ensure good profits from the trade, you need to keep in mind your risk-reward ratio.
It would be best if you always remembered that managing your risk is as important as earning good profits from any trade.
Find other important Candlestick Patterns here
Conclusion – Two Black Gapping Candlestick Pattern
The two black gapping candlestick pattern is simple to use and identify. The pattern is used to profit from the downward movement of prices.
There are two bearish candles which are formed gap down. The breakout candle also plays a significant role in letting the trader know if the downtrend will continue or not.
Just like all other candlestick patterns, this pattern cannot be used in solidarity. One needs to make use of volume indicators to ensure that the position is profitable.
This easy to use pattern has a very high success rate. So, all traders can try spotting it in a bearish market easily!
Open Demat Account in 10 Min & Start Trading Now!
Learn everything about Technical Analysis
| Learn Technical Analysis |
| How to Start Technical Analysis? |
| Best Intraday Indicators |
| Types of Technical Charts |
| Know about Resistance & Support |
| Dow Theory |
| Fibonacci Retracement |