Bullish Engulfing Candlestick Pattern – Meaning, Relevance, Examples & more
Last Updated Date: Nov 16, 2022Bullish Engulfing Candlestick Pattern is used to depict a bullish reversal pattern for security. The most common point to observe such a pattern is at the bottom of a downtrend.
Instead of one single candle, a bullish engulfing pattern consists of two candlesticks. It is among the clearest price action signals which indicate a specific outcome.
This is why traders consider this strategy as a vital one to identify target price reversals and support their trading strategies on its basis.
What is a Bullish Engulfing Candlestick Pattern?
When a bullish engulfing candlestick pattern appears at the lower end of a downtrend, it is a clear indication of an increase in the buying pressure.
The appearance of a bullish engulfing candlestick pattern might trigger a trend reversal since more buyers are likely to enter the market.
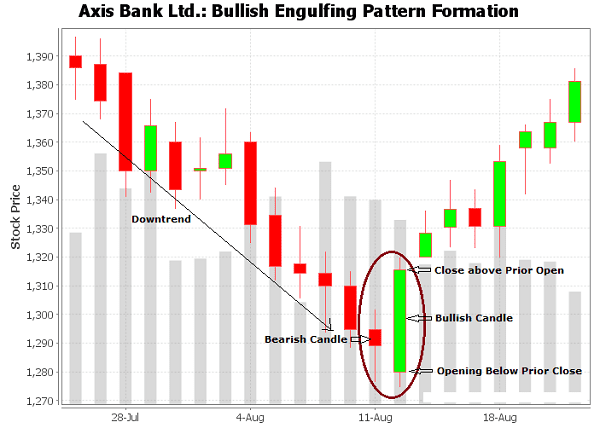
As a result, prices will drive higher due to such a trend. Take a look at the example below to understand how a bullish engulfing candlestick chart looks like.
A bullish engulfing pattern will always appear in a combination of two candles. Here, the second candle will always be greater in size than the previous candle such that it appears as though it is engulfing the candle before it.
Further, we can say that the red candle is a bearish candle while the green candle is a bullish candle. A candle will be bullish only when it will close above the opening price of the previous candle.
It is important that the length of the bullish candle must be more than the bearish candle.
Also, it is important that the bullish candle must open at a price which is same as, or lower than the closing price of the bearish candle.
Open Demat Account in 10 Min & Start Trading Now!
How to use Bullish Engulfing Candlestick Pattern?
As already discussed, there are a few characteristics which determine the appearance of a bullish engulfing candlestick pattern.
For a trader, the occurrence of such a pattern can mean a bullish reversal. It could set a trend reversal on the upside and mark the beginning of selling pressure.
For a trader, a bullish engulfing candlestick is an easy pattern to identify. It presents an easy entry to traders in the trade and gives them an early mover advantage which they may bank upon.
Know about other major Candlestick Patterns
Trading with a Bullish Engulfing Candlestick Pattern
The concept of a bullish engulfing candlestick pattern can be easily applied to the stock market.
You will find many signals and indicators to support the findings of a bullish engulfing candlestick chart. Let us take an example below:
As can be seen from the example above, the security finally breaks down and shows a continuous downtrend. It lasts for about a month after which part one of our bullish engulfing candlestick pattern forms.
On the very next trading day, initially, the price of the security opens slightly lower than the price at which the security closed on the previous day. Now, realizing the candle formation, buyers enter the trade in this security.
Due to their collective action, the price of the security pushes up. Now the price of the security closes slightly higher than the length of the first candle itself.
It is clearly visible that the upper shadow of the second candle of our bullish engulfing candlestick pattern is a short one.
It is indicative of the fact that the closing price of the security is quite close to the higher price limit of the security for that day.
Thus, the decline in the security comes to a halt and in its place, an uptrend appears.
Steps of using Bullish Engulfing Candlestick Chart
If a trader decides to enter into a trade for such security, they can do so by following these steps:
- The security must be bought at a price which is slightly higher than the highest price of the second candle which forms in the bullish engulfing candlestick pattern.
- The trader must determine a level of stop loss at which they must exit from the strategy. It can be at the market price or at a price which is lower than the lowest point of the second candle. Alternatively, it can also be a point below the lowest point of the first candle which forms as a result of the bullish engulfing pattern.
The trader must bear in mind that it is not necessary for every bullish engulfing candlestick pattern to work in their favour.
They must collude with appropriate risk management skills and trade definition to form a successful long term trading strategy.
A bullish engulfing candlestick chart is even more suggestive and powerful if you use it in conjunction with the study of the support and resistance levels.
Basically, the bullish engulfing candlestick pattern itself is a combination of one pattern with another technical pattern.
This is the double bottom trend which clearly indicates a significant trend reversal. It is also important to keep a check over ongoing market news about the stock in the days to come after you have taken a position in the trade.
A startling news has the potential to overthrow your strategy. It may cause fluctuations in the price of the security by unprecedented levels.
So it is always a wise idea to stay updated with news for security.
Find other important Candlestick Patterns here
Difference between a Bullish and Bearish engulfing pattern
Yes, engulfing patterns may appear as a bullish trend or a bearish trend. Both are opposite to each other. The pattern discussed above is a bullish engulfing pattern.
So, conversely, a bearish engulfing pattern will appear at the top of an uptrend. It will signal to the trader that it is time to go short on trade with the security.
And what you will see is a green candle being engulfed by a larger red candle in this case.
Conclusion – Bullish Engulfing Candlestick Pattern
A bullish engulfing candlestick pattern is an important indicator of the impending change in the price movement of a security.
Hence, a trader must follow it with careful observation to understand the shape that it takes.
Open Demat Account in 10 Min & Start Trading Now!
Learn everything about Technical Analysis
| Learn Technical Analysis |
| How to Start Technical Analysis? |
| Best Intraday Indicators |
| Types of Technical Charts |
| Know about Resistance & Support |
| Dow Theory |
| Fibonacci Retracement |