Hammer Candlestick Pattern – Meaning, Usage in Trading, Example & more
Last Updated Date: Nov 17, 2022In Hammer Candlestick Pattern, traders can observe on the charts, depicting price actions. A pattern such as this one emerges when a security trades significantly lower than its opening price.
The pattern draws its name from the appearance of a hammer shape, marked significantly by the appearance of a prominent lower shadow which can be twice the size of the real body of the candle.
The candle stick itself represents the difference between the opening and closing prices of a security. The shadow of the candle stick represents the upper and lower price of the security for the day.
Let us find out more about a hammer candle stick in vast detail.
What is Hammer Candlestick Pattern?
As discussed above, a hammer candlestick signals a bullish reversal in the market. It is a signal to a bullish trend reversal in the market.
There are two types of hammer candle sticks and the most common type out of the two is a bullish hammer candlestick.
Bullish Hammer Candlestick
Such a type of hammer candle stick will appear at the bottom of a downtrend and signals that a bullish reversal will occur. The body of a hammer formation is small and nearly no upper shadow but a long lower shadow.
This pattern indicates that the price of the security fell down to its new lows but got pushed up by buying pressure.
Inverted Hammer Candlestick
This type of hammer candle stick is very similar to the bullish hammer candlestick. This pattern also signals a bullish reversal but it tends to form an extended upper wick but nearly no lower wick.
This candle indicates that the price returns down to the opening levels but eventually closes above the opening price.
Open Demat Account in 10 Min & Start Trading Now!
Understanding Hammer Candlestick Pattern
A hammer candle stick pattern will manifest after a security has been on a decline. A closer look of the pattern will reveal that this declining pattern might make a market bottom in the days to come.
Thus, it is no surprise that a hammer signals two very pertinent pointers. This is because on the one hand, it indicates capitulation by sellers to tread the bottom of security.
On the other hand, it also indicates a reversal in the direction of the security owing to a price rise. This is most likely to happen when the price of a security falls down after opening but then rises back up again to close near the opening price.
Deciphering the Shape of a Hammer Candle Stick
When a candle stick appears in the shape of ‘T’, it is indicative of a hammer formation.
Thus, when a hammer formation occurs, an investor can infer that there is no control of bears over the price now. This is when the signal for an uptrend becomes most unambiguous.
Formation of more than three bearish candle sticks behind it gives a conformation to a hammer candle stick pattern.
Further, when the candle after a hammer candlestick closes above the closing price of the hammer itself, it is a complete proof of its formation.
At this point, an investor can be sure that the bullish trend reversal has taken place. It is ideal to take a long position only after a confirmation candle such as this one has formed.
For traders who like to place a stop loss, a low of the hammer shadow can serve as an ideal point.
A hammer pattern is said to be bullish when the high point and closing point are the same. This indicates that a bullish trend was able to push the price of the security past its opening price.
In contrast, when the high point and opening point are the same, the hammer candle stick is regarded to be less bullish.
This indicates that the action of the bulls was unable to counteract the impact of the bears.
A hammer candlestick chart usually forms a long lower shadow because of demand and support test by the market.
At the point of support, the bulls in the market pushed the prices higher to take it closer to the opening price.
Know about other major Candlestick Patterns
Example of a Hammer Candlestick Pattern
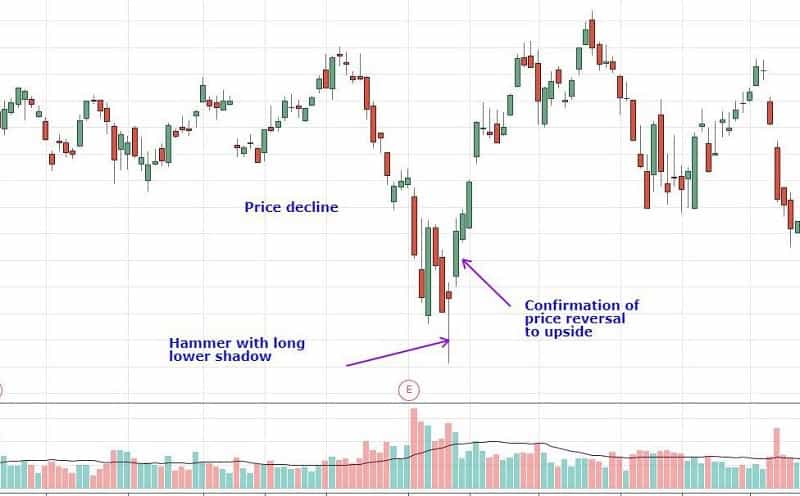
The patterns above indicate the different types of hammer pattern which can form in the market.
In the image above, a hammer candle stick is apparent at the point marked. The red candle indicates that the price of security closed at a lower point than its opening point. However, it also marked a low for the day but rose back up again.
The long lower shadow is indicative of the formation of a hammer candlestick formation. Further, the presence of more than three red candles just before the hammer candle stick is a further indication of its formation.
In this chart, the hammer candle has a long lower shadow. It is indicative that a significant price reversal is going to occur. With the next candle gapping higher than the hammer candle, it is a clear confirmation of its formation.
It is during this time that traders can generally pitch in to take a position in the market. The market tests the forces of demand and supply to check how far lower the price of the security can fall.
The bulls of the market ultimately push back the price of the security upwards.
What makes Hammer Candle Stick Important?
Here are some points which summarize the relevance of a hammer candle sticks in the study of market trends:
- Although it does not serve as a standalone indicator, it does lead as an indication which can tell the investor about impending changes in the market, marking the onset of bullish and bearish momentum in the market.
- Completed hammers help the investor to confirm the occurrence of a significant price movement in the market.
- The length of the shadow of a candle significantly confirms the reversal in the trend of the market.
- Hammer candlestick formation also help to confirm and strengthen various other trend reversal indicators in the market.
Find other important Candlestick Patterns here
What are the Advantages and Disadvantages of a Hammer Candlestick Pattern?
As with any other pattern formation, hammer candle stick pattern have their own advantages and limitations. This merits taking a trading position only when there is confirmation of a hammer candle.
Advantages of Hammer Candlestick Chart
Reversal signal – A hammer candlestick is synonymous of rejection of lower level price by the forces of the market.
Appearing in a downtrend, it indicates that selling pressure is at an end and a reversal is going to take place.
Exit signal – An existing short position by traders could benefit through the indication of subsiding selling pressure. Thus, they can easily close their short position at an appropriate time.
Limitations of Hammer Candlestick Pattern
Lacks indication of a trend – As such, the hammer chart formation does not take into account any trend formation.
Thus, when taken into consideration on its own, it can give a false indication which may not be representative of the actual trend.
Need for a supporting resource – Traders cannot rely solely on a hammer candle stick to make a high level of trade.
They would need additional information to decide the direction of the trend and the position that they would like to take.
Hammers are not usually used in isolation by traders. A variety of trend analysis is used by them to decide the market trend.
In Conclusion to Hammer Candlestick Pattern
On its own, the hammer candle stick pattern can be quite helpful to study the impending demand and supply.
Once a downtrend occurs, a hammer can indicate to the investor that the downtrend is now over and it is possible to cover the short positions.
However, to really step in and buy something in the market, traders must make use of other supporting resources as well.
A very close and similar pattern to hammer candle stick is the Dragonfly Doji pattern.
Open Demat Account in 10 Min & Start Trading Now!
Learn everything about Technical Analysis
| Learn Technical Analysis |
| How to Start Technical Analysis? |
| Best Intraday Indicators |
| Types of Technical Charts |
| Know about Resistance & Support |
| Dow Theory |
| Fibonacci Retracement |