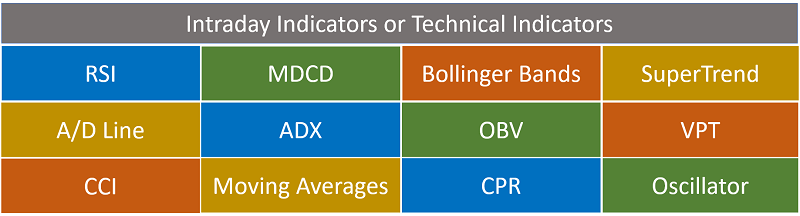
Best Indicator for Intraday Trading: Indicators used in Day Trading
Last Updated Date: Apr 23, 2022Know everything about Intraday Indicators or Technical Indicators here. These indicators helps in technical analysis & determining the performance of stocks on daily basis.
Be it a fresher or a professional; a clear know-how pattern must be fully-established in a trader’s mind on every elementary rule, strategy, and tip if they want to experience success in the trading world.
However, for most people, trading becomes challenging as they start getting introduced to unpredictable patterns. But, it happens when a trader isn’t fully aware of the trading environment.
That’s why, before initiating any investment, you must have a hang of basic knowledge to stay profitable in the market for the long-run.
You’ll first have to raise your familiarity with trading and its types, most notably intraday trading. So let’s discuss it next.
About Intraday Indicators or Technical Indicators
If you’re just a beginner, you need to know that professional traders use some special tools to thoroughly analyze the market.
Each tool follows a different pattern based on the historical data, but the outcome always stays unpredictable.
Hence, a trader must create an insight into the market and follow up on the action.
Similarly, the Intraday Trading Indicator tool helps a trader capture a comprehensive study of the stock market, initiate investment and enjoy the high return at the end of intraday trading hours.
However, the decisions in Intraday Trading Indicators are influenced by the Price movement.
That’s why an analyst will require undertaking extensive research and book profits. Similarly, you require assistance from certain technical indicators or intraday indicators.
It helps you get familiar with the stock market and create a strategy accordingly to achieve the results better.
Best Intraday Indicators or Top Technical Tools for Technical Analysis
There are two basic types of indicators, leading and lagging. As the name suggests, the leading indicator leads to the price suggesting the possibility of a reversal or a new trend before it occurs.
It is to be noted that some of these indicators might not be accurate. Thus, one should be careful while using them.
Many of the leading indicators are what we refer to as oscillators as they differ and move within a bounded range of two extreme values. The understanding of the trading can vary with the oscillator’s reading.
At the same time, a lagging indicator lags the price and suggests the possibility of a reversal or a new trend after the occurrence.
Here are most used Intraday Indicators by Research Analysts –
Moving averages is one of the most popular lagging indicators. It is used within indicators like RSI, MACD, Stochastic, etc.
Open a Demat Account Now! – Start Trading
Relative Strength Index (RSI) – Best Intraday Indicator
The RSI is one of the popular indicators created by J. Welles Wilder. RSI is used for measuring momentum and identifying trend reversal.
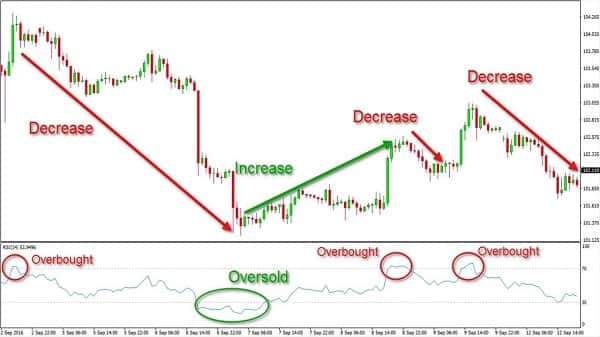
It changes between 0 and 100. The expectations and the decisions on the market are made by the latest indicator reading.
RSI helps to detect the internal strength of the security. We can calculate the same by using the following formula:
RSI = 100 – (100/1+RS), where RS is the average gain / average loss.
This can be illustrated with an example. Consider that the stock is trading at 99 on day 0. A set of data points can be calculated with this.
A total of 15 data points will give a look back period with respect to days.
Calculate RSI
For calculating RS or the RSI factor, we use the formula, the ratio of average points received to the average point lost. Thus, the average points received = 29/15 =1.93 and Average points on loss = 10/15 =0.666666667
This gives RS = 1.93 /0.666666667 = 2.89500. Using this in the RSI formula,
RSI = 100 –[ 100 / (1+2.89500)]
Further, RSI = 100 – [100/3.89500]
Then, RSI = 100 – 25.6739409
Finally, RSI = 74.3260591
The main aim of using the RSI measure is to help traders to detect oversold and over purchase price area.
Moving Average Convergence and Divergence (MACD)
This is another important Intraday Indicator tool for any Pro Trader.
This method has come to existence after the thoughts of Gerald Appel and the traders usually call it the Grand Old Daddy of indicator.
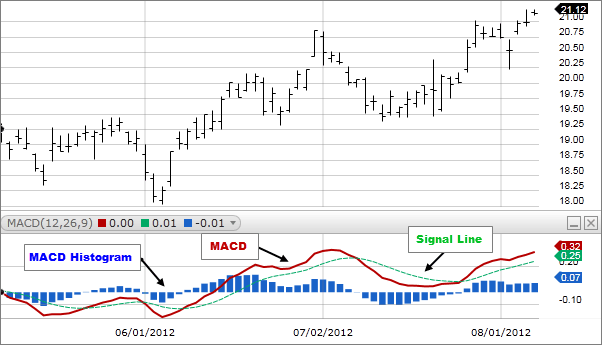
Even though this was introduced way back, the traders still prefer it as a reliable indicator given its efficiency. The convergence and divergence of the two averages is what will be focused here.
Convergence is referred to as the case when two moving averages work towards each other, while divergence is characterized by two moving averages moving away from each other.
This can be converted into a graph referred to as the MACD Line which oscillates above and below the central line.
The sign that comes along the MACD suggests the direction of movement of the stock. For example, consider that the 12 day EMA is 6380 and the 26 day EMA is 6220.
Then, the MACD value would be +160.
Bollinger Bands – Best Intraday Trading Tools or Indicators
Another important tool for Intraday Indicators or Technical Indicators is Bollinger Bands.
The Bollinger bands are great indicators to be of use in technical analysis. It mainly comprises three components.
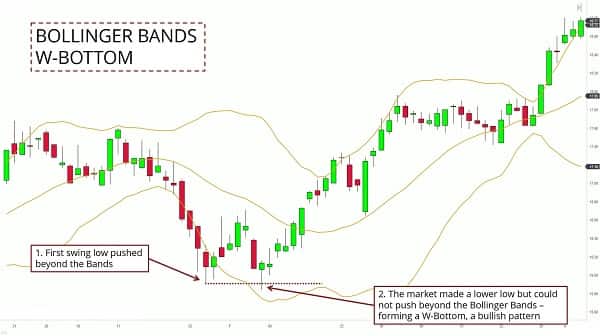
A middle line signifies the 20-day moving averages of the closing prices. An upper band stands as the +2 SD of the middle line.
The third one is a lower band which is the -2 SD of the middle line.
Standard deviation helps to evaluate the variance of a specific variable from its average. Here, it would stand for the volatility of the stock.
Example
In BB, the SD is applicable on the 29 days SMA. Consider that the 20 days SMA is 7800 and the SD is 75. The +2 SD would be 7800 + (75×2) = 7950. Similarly, we would get the – 2 deviation as of 7650.
In this condition, one can expect the current market price to be around 7800. But if it is around 7969, it would be an expensive one.
Thus, it would be better to look at shorting opportunities by expecting that the price would move back to average.
Similarly, if the current price is 7650, we would be considering it to be a cheap one. In this condition, one can choose to buy opportunities with the expectation of prices moving back to average.
BB gives a good result in the case of the sideways market but can fail in the trending market.
There are various other indicators. However, one needs to know all of these for being a successful trader. Just having basic knowledge about the prime indicators would help traders to be successful.
Super Trend as Intraday Indicator or Tool
The trader should have an understanding of the ATR (Average True Range) before jumping onto the technical indicators which is a “super trend”.
This will be employing the ATR values in order to evaluate the indicator value. This particular indicator comes over the price chart of the stock and the Indicator line will have a change of color.
The colors could either be Red or Green based on the movement of price in the stock. Super Trend does not have the capability to predict the direction.
However, once we establish the direction then initiating a position becomes easier. The trader can easily find out if he has to stay in the position until the trend stays.
Commodity Capital Index or CCI – Top Intraday Tool
Developed in 1980 by Donald Lambert (a technical Analyst), the Commodity channel was initially designed to serve the trading community as a helpful analysis tool.
Thus, CCI is an effective way for traders to create a clear pattern of overbought and oversold phases in the market.
In addition to these phases, CCI also helps the trading community identify the ‘trend direction and strength of the stocks.’ It helps them to have an overview of the market and identify the emerging buy or sell opportunity.
That’s why it’s one of the most used indicators that comprehensively display the ‘buy and sell’ signal to the trader.
Over time, the effectiveness of CCI was started to be realized at a large scale. And not just traders, but across all markets or timeframes, this analysis tool became popular.
Few traders use CCI to get an idea about the dominant trend on a longer-term chart; on the other hand, few traders use CCI on a shorter-term chart to generate trade signals in some risky situations.
CCI is to satisfy the following conditions –
- In the “overbought” condition, 75% price movement is essential to stay between +100.
- In “oversold” condition, 75% of price movement is essential to stay between -100.
Let’s understand how a trader should use CCI to get a glimpse of potential buy and sell signals. Have a look at the example given below in the chart.
Stochastic Oscillator – Top Technical Analysis Tool
We all can agree to the fact that our stock market is exceptionally volatile. Therefore, it makes sense to seek help at times and prepare an adept strategy when dealing with securities.
That is when a Stochastic Oscillator is pivotal. Now, those who are wondering what that it; it is primarily an analyzing tool.
What it does is, it acts as the momentum indicator, while you compare the closing price of a security to its other ranges. Of course, the basic calculation is on a particular period.
Investors can choose to makes necessary adjustments in context with the oscillator’s sensitivity to price movements.
Aiming to reduce the sensitivity, one can make changes to the time period or choose to take a moving average of result.
So, it is the ideal solution by which you can figure out whether a stock has moved to be Overbought or Oversold.
A brief History on Stochastic Oscillator
In the late 1950s, an American Technical Analyst named George Lane designed the theories of Stochastic Oscillator. The idea was to locate the closing price of a particular stock.
So, you can figure out the high and low-price range of any stock over a period. Then, Lane discovered that the period is around 14 days.
Over the years, there are several changes in its composition, but the core idea and the construction remain the same for Stochastic Oscillator.
Let us now know more about its construction process.
Advance Decline Line or A/D Line – Best Intraday Indicator
The history of Advanced Decline Line dates back to 1930, though the indicator got a big boost when Richard Russell in 1960s started using it.
As opposed to market index movement, the A/D line is supposed to be more useful to measure the stock market’s ever-changing strength.
However, when a trader wants to get an idea about the overall market strength, AD line is quite fruitful.
When irrespective of declining the stocks are only advancing, so this indicates that the A/D line will go up (or vice-versa).
Mostly traders accept that A/D line can provide a perfect vision of market strength as compared to standard indices, e.g., S&P index or DJIA (Dow Jones Industrial Average).
An in-depth study of A/D Line can provide the analysts with a comprehensive overview of the rising and falling trend in the market. For how long the trend will stay or vanish, it outlines the exact figures.
AD line provides investors with an insightful indication thoroughly about the participation of the entire stocks in a specific index in the market’s direction.
For instance- if a capitalization-weighted stock index (such as the DJIA, S&P 500, and the NASDAQ Composite) rose by 3%, it will become essential for the investor to get an insight into the Index.
The rise in the Index is possible because the majority of the stocks are gliding up or strong performance of a company can also be the leading reason.
Average Directional Index or ADX – Technical Indicator
The famed technical analyst Welles Wilder had introduced the ADX indicator. The ADX indicator is not similar to RSI as it doesn’t tell whether the trend is bearish or bullish; instead, it determines the strength of the ongoing trend.
Ideally, the ADX or average directional movement index is determined to show either contraction or expansion of the stock or security over a specific period.
Generally, ADX is calculated 14 time periods, but experts tend to commonly use this indicator with both low, including seven, and high, including 30 periods.
More tropical settings are most likely to make the ADX to respond instantly to the price movement, but the main issue here is it might also give out false signals.
On the other hand, the best part about higher settings is that it reduces fake alerts and makes the ADX an indicator of a more lagging one.
The indicator makes the trader aware when the market is trending, and it also removes the anti-trends that helps the trader to understand chasing indicators from regular whipsaws.
On Balance Volume or OBV Indicator – Top Intraday Indicator
You might be curious to dig down on the topic and learn more about the indicator, but you must be precise with some basics before diving deep, of course.
So, basically, as per the theory, the price and volume are correlated. The on-balance volume technical indicator ideally determines the buying and selling pressure, which is mainly dependent on an aggregate basis.
It integrates the volume on up days while on the down day’s volume is eradicated. Above all, you need to know on balance volume is one of the first indicators that determine positive and negative volume flow.
Joe Granville had developed this indicator. This indicator is generally used by people to affirm the price trend and also understand the correlation between the price and on-balance volume.
Volume Price Trend or VPT Indicator – Best Technical Analysis Tool
If you want to become a professional trader without any restrictions, then the volume price trend is your best bet as you get the freedom to become a trader without any stress.
Often the volume price trend is also known as the price volume trend. To form the hybrid trading indicator featuring two variables, the volume price indicator tends to mix price and volume.
The main idea of creating the indicator is to enhance the volume of the market by the change in the percentage in the price over a given period of time.
The value of the indicator mainly declines when the price falls, and it is due to the pessimistic value. The value of the indicator is most likely to increase with the increase in the price.
Ideally, the volume of the price trend indicator is similar to the on-balance volume indicator.
The only difference between the two indicators is that the indicator is most likely to rise or fall with the on-balance volume indicator depending on the price that easily made some high or low.
The extent of the move is not included in the indicator calculation. While on the other hand, the volume price trend indicator moves mainly depend on how big or small the shift was made with regards to price.
One of the most common promises made behind the volume price trend indicator is that the indicator has to be in the same direction as the price.
The market is said to be going in a reversal trend when the price moves with low volume.
Moving Averages – Top Technical Indicator
When it comes to Technical Analysis, we often dissert about Moving Averages (a fundamental indicator). It’s also recognized as the oldest technical indicators.
For the market analysis, Moving Average is the best approach used by technical analysts. To get an idea about the latest trend, technical analysts use Moving Average, which helps them a lot in the volatile markets.
In a ‘smooth manner,’ MA provides a clear insight into the stock/security trend at a varying price with less apparent volatility. Moving Average is also identified as a foundation of other conjunctions, such as- MACD (Moving Average Convergence Divergence).
But this technical indicator doesn’t predict the direction of the price; indeed, it states precisely about the current direction followed by past prices. Next, we’ll go into the Moving Averages types for a thorough discussion.
Central Pivotal Range (CPR) – Best Technical Tools
The central pivotal range (CPR) is the most prominent technical indicators for traders on price. CPR is mostly to identify the stock price movements by indicating crucial price points.
The traders largely use it for intraday trading. This efficient indicator provides a range that incorporates 3 different levels, which are the pivot point, top central pivot point, and bottom central pivot point.
Calculating the 3 different pivot points within the CPR is as follows,
- Pivot point- (High + Low + Close)/ 3
- Bottom central pivot point (BC)- (High + Low)/ 2
- Top central pivot point- (Pivot – BC) + Pivot
The High, Low, and Close refer to the previous schedule’s highest, lowest, and closing price of the stock respectively.
As per this calculation, the highest value is often the TC value and the lowest is that of BC.
The CPR approach works basically on the idea that understanding the market trend using the prices of the previous period can help the trader in predicting the price movement for the next schedule.
How Technical Indicators work?
Technical analysis is one of the most prominent things followed by traders before reaching the buy or sell decision. It helps traders to spot the trading opportunity through a comprehensive study of the investments.
For this, technical indicators mainly focus on the trading activity’s statistical trends, e.g., price movement or volume of the stocks.
It’s completely different from the regular analysts’ practices who evaluate the intrinsic value of the securities through an overview of the financial and economic data.
On the other hand, technical analysts follow the price movement’s pattern, trading signal, and plenty of other analytical tools to identify the strength and weaknesses of the security.
Through historical trading data, an analyst can effectively initiate a technical analysis of any security. For example- it can be anything, from stocks, commodities, futures, currencies, fixed-income, etc.
However, technical analysis is more important across forex markets, commodities, etc. because here, traders only focus on price movements for the short-term.
Technical Indicators don’t pay any heed to the earnings, profit margins, and revenue of a business. Still, a trader can use these points for additional information and narrow down the decision.
However, investors planning to invest in the long-term can get an idea of the entry and exit points.
Why Intraday Trading Indicators are beneficial?
These are some of the major benefits a trader gets from Intraday Indicator Tools –
Latest Insight – Through Intraday Trading Indicators, traders grasp the latest insight on pointers describing the stock market situation.
It helps them to come across the best decision that promises profitable results.
Understanding Market Trend – Intraday Trading Indicators also support a trader’s understanding of the market trend by indicating the directions (downward or upward).
Through this market trend direction, a trader obtains a clear insight into the price movements.
Momentum Detection – The momentum detection in the stock market becomes possible with this indicator because, in most instances, existing or lack of momentum can hamper returns.
Demand for Securities – A trader can also assess the demand for securities through a comprehensive measurement of the volume.
Similarly, how much the securities are popular among other traders, Intraday Trading Indicators defines it all.
Market Movement – Even though there’s a market movement or not, this indicator assists traders with some requisite information with them.
However, it comprehensively defines the volatility in the stock market, e.g., it can be available or lack for profits-booking.
How to use Intraday Indicators?
Now, you’re also familiar with trading indicators; still, it’s a bit tricky task to settle on the best intraday trading indicators.
That’s why, below, we’ve aligned some of the effective tips to ensure which indicator includes everything to be called an excellent way to choose for intraday trading.
Intraday Trading with Indicators or No indicators
In most instances, traders avoid using any indicator because most of the trading is initiated on the basis of the stock’s price. Similarly, the traders observe the minimal requirement of the indicators.
Still, lots of traders use Intraday Trading Indicators because it provides them with some special information which is about the market trend, which is often difficult to acquire through a price chart.
Still, these indicators never provide you with any sign of trend reversal because the entire data represents the historic or current price and volume.
Redundant Intraday Trading Indicators
Few indicators can be similar to other indicators with a slight distinction.
They also share the same traits in the same groups. That’s why if you’re using these types of indicators, then you can expect repetitive results.
Hence, in addition to helping you, these indicators will only consume your extensive time. In most instances, the end results can be completely unfavorable.
Therefore, it’ll be ideal if you choose an indicator from each group to avoid redundancy and reach closer to the results.
Combining of Intraday Trading Indicators
In several situations, the intraday trading indicators are combined to grab the essential information, such as market direction, trading opportunities, trends, and so on.
However, the combination of these indicators can vary based on the trader’s choice.
Technical Indicators or Intraday Indicators – Conclusion
Online Trading is one of the most effective ways of making money and thus is immensely popular. Online trading means buying or selling investments after studying the market conditions.
This buying and selling take place on online platforms which are owned by proprietary firms.
These platforms also provide proper guidance to the investors in how to increase their money and which time is right to invest and which time is not.
It is of utmost importance to know and understand volatility spread options as it allows the evaluation of options that are either cheap or expensive.
We basically do it by comparing implied volatility to historical volatility. Traders who have just begun their journey should have a thorough knowledge or research base for volatility-based training.
Volatility based trading happens by implementing volatility spread options and a handful of strategies to survive the competitive market.
Intraday Indicators FAQs
Ques – How to calculate RSI or relative strength index?
Answer – For calculating RS or the RSI factor, we use the formula, the ratio of average points received to the average point lost. Thus, the average points received = 29/15 =1.93 and Average points on loss = 10/15 =0.666666667
This gives RS = 1.93 /0.666666667 = 2.89500. Using this in the RSI formula,
RSI = 100 –[ 100 / (1+2.89500)]
Further, RSI = 100 – [100/3.89500]
Then, RSI = 100 – 25.6739409
Finally, RSI = 74.3260591.
Ques – Where can I find MACD calculator?
Answer – This calculator was introduced a long time ago but traders still use it because it is a reliable indicator. The convergence and divergence can be converted into a graph and that can be referred to as MACD line that oscillates above and below the Central line and can be found in this very article itself.
Ques – What do you mean by moving averages in intraday trading?
Answer – Moving average is used in technical analysis in order to understand what’s happening in the volatile markets. It provides a pretty clear view into this stock trend with less volatility. However, it doesn’t predict the direction of the price but very precisely states the current direction followed by past prices.
Ques – What does Stochastic Oscillator indicates?
Answer – It is a momentum indicator used while you compare the closing price of a security to its other ranges. Investors and traders can choose to make any and every adjustment regarding the oscillator’s sensitivity to the movements in price.
Ques – What does On Balance Volume or OBV Indicator determines?
Answer – It figures out the volume on up days while on the other days, the volume is subsequently diminished. It determines the positive and negative volume flow, all in all. This is used by people to regulate the price trend and understand the relation between price and on balance volume as such.
Ques – How is Commodity Capital Index or CCI index helpful to traders?
Answer – The CCI is an effective way for traders and investors to create a pattern of faces in the market that has been oversold. It also helps the trading community to identify the trend direction and the ultimate strength of the stocks.
Ques – Where can I learn about different intraday indicators?
Answer – You can learn about different intraday indicators in this article provided on the website. Nevertheless, you should be pretty careful while you use them. Most of these indicators usually differ by a few values.
Ques – Which are the most used intraday indicators?
Answer – Moving Averages, Bollinger Bands, RSI and Stochastic Oscillators are the most used intraday indicators.
Ques – What does the Bollinger Bands indicates in intraday trading?
Answer – Out of its three components, the middle line signifies a 20 day moving average of every closing price. Then comes a lowering band which is the minus 2SD of the middle line. Standard deviation will assist in evaluating the changing variable from its average.
Ques – How is Average Directional Index or ADX is helpful to the traders?
Answer – ADX responds pretty quickly to price movements happening inside the market. This indicator will subsequently make the investor or trader aware when the market is trending and when it is not.
Open a Demat Account Now! – Start Trading
Most Read Articles