Bullish Harami Candlestick Pattern – Meaning, Identification, Reliability, Usage & more
Last Updated Date: Nov 16, 2022This article is oriented towards the Bullish Harami Candlestick Pattern. It belongs to the group of technical trading tools used to make investment decisions.
Purchases in financial assets and the stock market are seen as risky investments, even though they provide us a long-term assurance.
You need to have a pretty good knowledge of stock and asset trading in the financial market. You can invest in the best and high returns stocks with little research and details.
However, some good methods will help you predict the market with profit and loss for your investments.
Well, you may have heard about the basics trading pattern and trends, here we have mentioned some in-depth about the most popular and the easiest chart pattern, known as Bullish Harami candlestick pattern.
So, a big shout out to all those who don’t know about Bullish harami candlestick pattern.
In this article, you will learn everything about this chart pattern and how to use the pattern in your day to day trading and stocks. Before we go deep, let’s learn a bit about the basics.
A little about Candlestick Charts
Of course, if you are trading or if you know these charts already, then you might be aware of candlestick charts too.
But, those who are just starting, you should know that candlestick charts help you to monitor the performance and the market/stock lines protruding either top or bottom, which will help you to predict the returns in lower than investment or higher than your investment.
The chart also speaks up for the low price, high price, opening price and closing price. Hence, if you understand and learn how to read candlestick charts, you can start trading right away.
Open Demat Account in 10 Min & Start Trading Now!
What is a Bullish Harami Pattern?
It’s just a chart pattern, designed as candlestick, which indicates the market trend and helps the trader or investor predict the market based on forward or reverse (in simple terms, if its profit or loss).
Analyzing the market becomes easier with Bullish Harami candlestick, as they indicate at the right time when the trend is coming to an end.
However, some financiers and stock investors take up Bullish harami as a perfect suggestion to enter into the market in the long position.
This pattern indicates the price movement, even by the minute increase in the price, which could be controlled in the downward price of the existing equity; the black candles also indicate it.
Know about other major Candlestick Patterns
How to identify Bullish Harami Pattern over a chart?
If you are an investor and just starting with the Bullish harami pattern, then you should first look for the market performance every day and make sure that you also know the market for the last few days.
The harami candle pattern looks over for two or more days of trading, while the bullish depends on the initial candles, which sees the downward price.
Don’t worry if you see this bullish pattern differently on your stock chart; the tactics and the identification methods are completely the same.
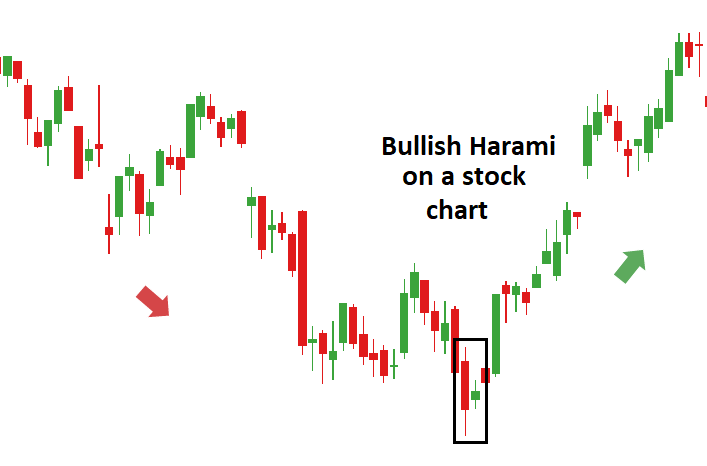
Bullish Harami Candlestick Chart Identification Process
- Look for the existing downtrend.
- You might get signals about trends slowing or reversing, wait for it- it will be candles moving in a crossover, or constant bullish pattern formations, or downward trend.
- Now, ensure that the small green body candle is no more than 25% of the previous candle on the chart. If the stocks are gaping up or high, then the green candle will go mid-way up than the previous candle or the bar.
- Keep in mind, when it is about the forex charts, then the candles will show side by side, not too high or low.
- The real bullish candle will be seen enclosed in the length of the previous candle in the chart.
- You can also take help and support from the indicators and the levels.
How does Bullish Harami Pattern work?
Firstly, there are two types of candlestick in the pattern:
- Small candle
- Larger candle
The pattern is either bearish or bullish. We will here talk about the bullish harami pattern.
This particular pattern appears when there is a huge bearish red candle on day 1, followed by different small candles on day 2. Remember, the candlestick and trend follow for more than two days.
That’s exactly what it does! The bullish pattern gap up the price on the second day and don’t become bearish nearing day 1.
For the bullish to appear, a small candle body will close much higher than the previous body, which signals the reverse market.
Find other important Candlestick Patterns here
How to trade using Bullish Harami Candlestick Pattern?
Well, here are some general considerations concerning the trading with the Bullish harami pattern. Let’s see them one by one.
Market Condition
Volatile stocks that have high beta values form bullish pattern, in general. You, as an investor, should select the most suitable stocks or indices. The selected price margin should be high and should breach the second bearish candle.
Only such a move will result in profit. However, there are limitations with such a trading method; hence, you may choose the stop-loss method.
Stop-Loss Limit
Now method differs from every trader to trader that also depends on their trading preferences. However, if you are going long, you can set the stop-loss proportion at 3 units below the candle’s lowest price.
If you are entering the high price, then you should be ready for the risk as well. For beginners, it is suggested to keep it low.
Trade Entry
Now, you know that the downtrend usually takes the reversal, and the prices will fall in the future. Hence, you can take up a low price for a long position, as usual.
Otherwise, you can also wait for a little longer and then take up the high price, as the profits will kick in soon. You have to plan strategically and with much patience!
Is Bullish Harami Candlestick Reliable?
Yes, it is! It is one of the most reliable candlestick pattern that are suitable both for beginners and experts.
It comes with opposite combinations supporting various interpretations. The long black stick closes on the low along with a short and white candlestick.
It is read as the market was in complete control on the first day and halted the selling movements on the second day, suggesting that the market might follow the downtrend for a while. This pattern is reliable and trustworthy!
You can also use the candlestick pattern and other pattern such as Bollinger bands, which would make it a perfect combination and the easiest to understand for beginners.
Conclusion – Bullish Harami Candlestick Pattern
Don’t be concerned if you are a beginner. Every investor has started as a beginner, and the fact is that Japanese candlestick are far easier than other trading pattern.
You can use the Bullish harami candlestick pattern, which would be great, and you have to gauge both the opening position and closing position for better understanding, and always keep an eye on previous day market positions.
Open Demat Account in 10 Min & Start Trading Now!
Learn everything about Technical Analysis
| Learn Technical Analysis |
| How to Start Technical Analysis? |
| Best Intraday Indicators |
| Types of Technical Charts |
| Know about Resistance & Support |
| Dow Theory |
| Fibonacci Retracement |