Hanging Man Candlestick Pattern – Meaning, Features, Usage, Limitation & More
Last Updated Date: Nov 17, 2022Another essential type of candlestick that you must know about is the hanging man candlestick pattern. Candlestick patterns mainly show the highs, lows, opening, and closing price of a stock for a specific duration.
Basically, these candlesticks depict the investor’s emotional impact on various stock prices. These candlesticks are mainly used by traders to understand when to exit and enter trades.
The term hanging man mainly depicts the candle’s shape and what the appearance of these patterns infers. The hanging man basically showcases a future reversal in an uptrend.
When it comes to selling an asset is individually based on the hanging man pattern is some risky proposition for many people.
It is a crucial piece of evidence that market sentiment is pleading to turn. Furthermore, the uptrend strength isn’t there anymore.
About Hanging Man Candlestick Pattern
Ideally, a hanging man candlestick pattern is a single-handed candlestick that is found on the peak of the uptrend.
The majority of the traders believe it to be a reliable indicator for determining changes in the direction of the trend.
It is ideally considered as a bearish candlestick trend that gives a warning that the market might make a reversal turn anytime, as the bulls are most likely to lose their momentum. When the hanging man is formed, the reversal isn’t most likely to start anytime soon.
Instead, it gives out a message that the current rate is in its closing stages as the price action is all set to future change in the direction of the trend.
Open Demat Account in 10 Min & Start Trading Now!
Features of Hanging Man Pattern
Steve Nison firstly introduced the hanging man candlestick pattern in the western world. These patterns are one of the most essential tools for technical analysis in the stock market.
These patterns include two or more candlesticks. If the candlesticks are green in color, then it indicates the market is bullish.
It is mainly because the opening price is more than the closing price for the duration of the trading.
While on the other hand, red candlesticks state that the closing price of the stock is less than the opening price, and they are known as bullish candlesticks.
One of the most critical features of candlesticks is the wick. The wick is also known as the shadow, and it mainly indicates the opening and closing price of the stock.
The closing price is shown by the upper threshold of the wick in a green candlestick, while the opening price of the stock is shown by the lower point of the wick in a red candlestick.
Mainly the hanging man candlestick is seen when the price of a particular stock is on the uptrend.
It states that the investor’s interest in the stock is waning, and they must be ready to sell the security, which will decrease the price of the stock.
It is generally believed that the hanging man pattern candlestick typically reveals the reversal in the market.
When the reversal trend is seen, there is no momentum in the market that states the price will propel upwards. Thus, it is not recommended to sell security by just looking at the hanging man candlestick.
Know about other major Candlestick Patterns
What does Hanging man Candlestick Chart tell you?
Ideally, a hanging man candlestick depicts a massive sell-off after the open, which makes the price go down but then buyers push the price back near to the opening price.
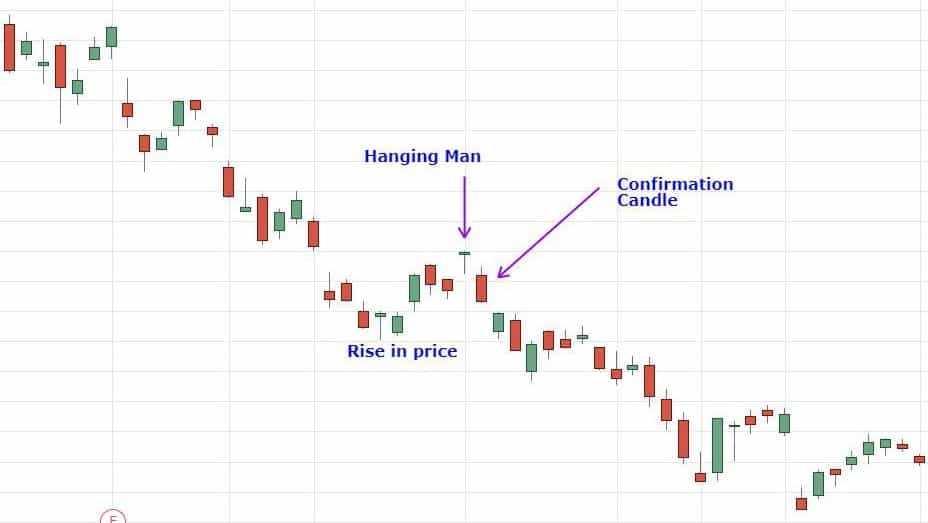
Traders take a hanging man candlestick as a signal that the bulls are ready to lose control in the market, and soon the security will enter the downtrend.
You will see the hanging man when the price of the security is high for at least a few candlesticks. Notably, it doesn’t need much hard work.
When the hanging man is seen as “T,” the candle appears only as a warning and doesn’t require any reason to act.
Unless the price falls down, the hanging man pattern candlestick is not confirmed. Even after you see the hanging man, the price shouldn’t close more than the high price of the hanging man candle as it suggests another candlestick potentially.
Following the hanging man candlestick, if the price falls, it is recommended that pattern and candlestick traders use it as a signal to enter short positions.
A stop loss is most likely placed beyond the high of the hanging man candlestick when entering the new short position.
Often hanging man candlestick pattern is not used in isolation; instead, they are used with integration with different types of analysis, including price or trend analysis.
How to Trade using Hanging Man Candlestick Pattern?
Traders who precede a bearish trading period suggest that a better than average trading volume and also feature a decrease in closing price.
You should also look for other indicators supporting the hanging man candlestick, including the relative strength index, moving averages, etc. to determine if the market is in reversal.
You should read the hanging man candlestick pattern as a warning instead of a sure shot trading signal.
Above the most recent high, ideally, the stop loss is positioned.
Find other important Candlestick Patterns here
Limitations of Hanging Man Candlestick Pattern
One of the common disadvantages of hanging man candlestick is that you have to wait for confirmation, and it can lead to a weak entry point.
Within two periods, the price is most likely to move up, and the potential reward cannot be calculated easily.
Furthermore, there is no assurance the price will reduce after the formation of the hanging man. When a short trade is initiated, it is essential to place a stop loss, to control risk.
Conclusion: Hanging Man Candlestick Pattern
When it comes to reliability, the hanging man candlestick pattern is only a mild predictor of the trend reversal.
Often the hanging men occur, and when traders highlight them on the majority of the charts, it can be said that these are one of the low indicators of a price.
It would be best if you looked for enhanced volume so the pattern becomes reliable. If you plan to trade, then you should use stop loss.
Open Demat Account in 10 Min & Start Trading Now!
Learn everything about Technical Analysis
| Learn Technical Analysis |
| How to Start Technical Analysis? |
| Best Intraday Indicators |
| Types of Technical Charts |
| Know about Resistance & Support |
| Dow Theory |
| Fibonacci Retracement |