Morning Star Candlestick Pattern – Meaning, Helpful for Trader, Formation & more
Last Updated Date: Nov 17, 2022Morning Star Candlestick Pattern is one of the most used technical analysis tool by technical analyst. Know everything about this kind of formation here.
This pattern is formed by three candles and is considered as an indication for a possible trend reversal in the market.
The traders can use this chart pattern in any market, be it equity, forex or commodity. It is a bullish reversal pattern and is the opposite of the evening star.
The morning star shows the slowing down of a downward move and indicates that an uptrend is about to follow.
About Morning Star Candlestick Pattern
Morning Star Candlestick Pattern is a vital pattern which can be observed in the price movement of a stock market security. Usually, a morning star pattern consists of three separate candlesticks.
Considered from the perspective of a trader or analyst, these candlesticks will most likely show a bullish sign in the price movement of the security. Usually, a morning star candlestick chart will be visible after a downtrend.
After its occurrence, traders will usually anticipate the onset of an upward climb in the price of the security. Thus, it is clearly understandable why it is known as a reversal in the price pattern.
For a trader, who is keen on trading in the stock market, a morning star candle stick pattern holds vital importance. They will usually keep a watch over the pattern to detect a reversal in the price trend.
They may, however, also rely on other indicators to make sure that a morning star pattern is indeed forming.
Open Demat Account in 10 Min & Start Trading Now!
How Morning Star Pattern is helpful for trader?
Since the morning star candlestick pattern is a visual pattern, the trader may not need to rely on multiple calculations to make sense of it.
A morning star candlestick will usually always form after three sessions. It is also possible that it may not form at all.
In addition to this pattern itself, the trader can also take clues from other technical indicators to identify the formation of a morning star pattern.
Some of the vital facts which a trader may make out from the formation of a morning star candlestick formation are price levels nearing a support zone.
Or else, it could show whether a stock or a commodity is nearing its oversold levels.
Know about other major Candlestick Patterns
How does a Morning Star Candlestick Pattern looks like?
The three candlesticks of a morning star candlestick pattern could appear in the following pattern.
On day 1, you may observe a bearish candle while on day 2, you may observe a small bullish or bearish candle. On day 3, a longer bullish candle may be observed.
Thus, a trader can infer many vital facts from the formation of these candles. On the first day, the candle is a reddish bearish candle. Well, on this day, the bears in the market are quite strong and keeping the price of the security low.
On the second day, the candle may show a bearish gap down. Thus, it shows that the bears are still on control of the price of the security. However, they are not in a position to pull down the price of the security steeply.
This is why the candle on the second day may not be a large one. It may be bullish, bearish or even a neutral one but always small.
If at all, the candle on the second day is a bullish one, it seeks to show a sign that a bullish trend reversal is on the cards. Moreover, this reversal is expected to be a strong one. However, the candle formation on day 3 is the most important one.
A trader may observe a bullish gap up and it is easy to watch how the bulls pull the price of the security upwards. This is how they may often erase the losses which may have occurred on day 1 of the trade.
What does the Morning Star Candlestick Pattern tell?
The tiny candle in the middle of the two candles indicates the giving up of sellers in front of the buyers.
That is the point when the bears are unable to compete with the bulls. This causes the trend to reverse from a bearish downtrend to a bullish uptrend.
The third candle in the morning star confirms this trend reversal and gives the trader a perfect entry point.
However, the trader needs to take into account volume and the fundamentals before solely trusting the technical.
Find other important Candlestick Patterns here
Identify a Morning Star Candlestick Formation
Even though a morning star candlestick pattern is easily identifiable, the three candles alone may not be sufficient for many traders.
Sometimes, traders also need to take into account the previous price action on security. Also, they may need to assess the appearance of the pattern during the existing trend.
Here are some vital points to observe if you are looking for the formation of a morning star candlestick chart.
Observe an existing downtrend
First, establish the presence of a downward trend. Ideally, there should be lower highs and lower lows in the market before a morning star candle stick appears.
Formation of a large bearish candle
Next, the appearance of a large bearish candle may begin to indicate the presence of a morning star candlestick pattern.
It is a result of extreme selling pressure in the market. At the same time, it also shows that the downtrend in the market is continuing.
So it is ideal for a trader to look for a short trade since there isn’t any sign of a reversal in the market yet.
Formation of a small candle
Next, the trader may need to observe the occurrence of a small bullish or bearish candle, right next to the large bearish candle.
It is usually a small candle with a smaller lower gap since it makes a lower low. It does not really matter whether the candle here is a bullish or bearish one.
The main point to note is that the market is not decided on the price movement as of yet.
Formation of a large bullish candle
Next, the appearance of a large bullish candle may be the final sign of a buying pressure in the market.
Continued price action
Usually, it gives rise to a new uptrend. Once the reversal takes place, it will be easy for a trader to observe a higher high and a higher low.
Traders should always observe other candlestick patterns and technical indicators before placing reliance on the indication laid down by the morning star candlestick pattern.
The occurrence of a morning star pattern may not be a frequent one in the stock market.
However, when it does appear, it shows a definite point of entry into the market. At the same time, it also shows many stop loss levels to the trader.
They are also quite easy to identify but it is possible for a failed reversal to occur. In this case, the price of security may fall down even more.
The morning star pattern indicates a bullish trend. The best entry point is at the opening of the very next candle after the pattern is complete. For the conservative traders, it is better to enter after the closing of another candle so that they are sure of the price action.
However, in fast-moving markets like forex, this can prove to be dangerous. In this situation, the trader might take a wrong entry at a much higher price level which would cause losses or very limited returns.
In order to be able to trade the morning star pattern well, you need to be aware of what the star looks like. The shape of the star is very similar to a Doji or a spinning top. But the formation is different, and hence, a careful analysis is required.
While trading using any technical chart pattern, the fundamentals also need to be kept in mind. If there is no supporting evidence of a strong bullish trend, then you might need to re-analyse your chart.
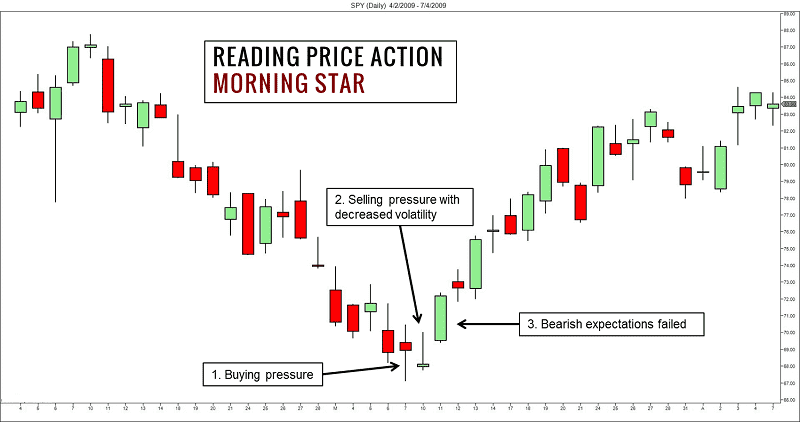
The following chart shows how a morning star candlestick pattern appears.
How to trade using Morning Star Candlestick Chart?
The morning star pattern indicates a bullish trend. The best entry point is at the opening of the very next candle after the pattern is complete.
For the conservative traders, it is better to enter after the closing of another candle so that they are sure of the price action.
However, in fast-moving markets like forex, this can prove to be dangerous. In this situation, the trader might take a wrong entry at a much higher price level which would cause losses or very limited returns.
In order to be able to trade the morning star pattern well, you need to be aware of what the star looks like. The shape of the star is very similar to a Doji or a spinning top. But the formation is different, and hence, a careful analysis is required.
While trading using any technical chart pattern, the fundamentals also need to be kept in mind. If there is no supporting evidence of a strong bullish trend, then you might need to re-analyse your chart.
When the Morning Star Formation is most reliable?
In the following situations, the reliability of the morning star increases:
- When the real body of the third candlestick opens above the body of the star, this leaves a gap between the body of the star and the candlestick.
- When there is a difference in the Volume, this means when, Volume in the first candlestick is below average, and the Volume in the third candlestick is much above the average.
- Difference between the heights of the first and third candlesticks. That is, when the third candlestick has no upper shadow, it is most reliable.
Benefits & Limitations of Morning Star Pattern
Here are the pros & cons –
Advantages
- There is a clearly defined entry point.
- It is also easy to keep a stop loss level.
- The pattern is easy to identify and analyse.
Limitations
- Can be easily mistaken for a Doji.
- Any small candle in the downtrend might be mistaken as a morning star.
Conclusion – Morning Star Candlestick Pattern
The morning star candlestick pattern is one of the easiest patterns to use. This pattern can be observed and analyzed quickly.
There are suitable entry points given clearly. This pattern can be used even by beginner traders. However, it is always advisable to take a look at the fundamentals as well while taking positions.
There is always a chance of failed reversal, and hence, fundamentals need to support technical for a good trade to happen.
Open Demat Account in 10 Min & Start Trading Now!
Learn everything about Technical Analysis
| Learn Technical Analysis |
| How to Start Technical Analysis? |
| Best Intraday Indicators |
| Types of Technical Charts |
| Know about Resistance & Support |
| Dow Theory |
| Fibonacci Retracement |