Bearish Harami Candlestick Pattern – Analysis, Formation, Indicators & more
Last Updated Date: Nov 16, 2022Know everything about Bearish Harami Candlestick Pattern here. Find all details like its Analysis, Formation, Trading tips, Indicators & more.
Lets get Started.
About Bearish Harami Candlestick Pattern
In simple words, the Bearish Harami Candlestick Pattern is an indication that the prices may fall soon.
The pattern is formed with the help of two candles that are green and red, respectively. The pattern is formed during an uptrend.
However, the following conditions are necessary for the formation of a bearish harami pattern.
The first candle formed is a bullish one represented by green color and generally formed during an uptrend.
Once the green candle is formed, the formation of red candles occurs, which is smaller than the previous green candle.
However, the important part here is the level of the red candle. It falls within the price bracket of the previous green candle only.
The open price for this candle is near the middle point of the previous green candle.
It is important to note that both the body and wick of the red candle must fall within the previous candle’s body so that the entire red candle is formed in the middle part of the green candle.
The pattern is also known as the ‘inside day’ pattern.
Open Demat Account in 10 Min & Start Trading Now!
Analysis of the Bearish Harami Candlestick Formation
Candlesticks are nothing but the visual representation of the market price for a security or index.
During the formation of candles, one sees various trendlines, patterns, and breakouts building up. The analysts use these patterns for analyzing the change in prices that might occur shortly.
However, these patterns are not the only factor one must consider while trading or investing simply because these are just representations of the price that, too, the past prices. The market is much more than just patterns.
Therefore it is affected by multiple factors, including news, international policies, national policies, global cues, etc., to name a few.
However, the patterns aren’t simply useless as they give you an idea about how security has been performing in the past.
Analyzing using the past performance does not give assurity as to how to security might perform in the future.
However, with the help of analysis, you can create various strategies to help you make money in the market.
As mentioned earlier, the Bearish Harami Pattern is formed during an uptrend and indicates a trend reversal.
However, the pattern is formed with the help of two candles. So let us analyze each one of two candles separately to get a better idea.
Know about other major Candlestick Patterns
How does a Bearish Harami Candlestick Chart Looks like?
Since the first candle is formed during an uptrend, it is green in color depicting an upside move.
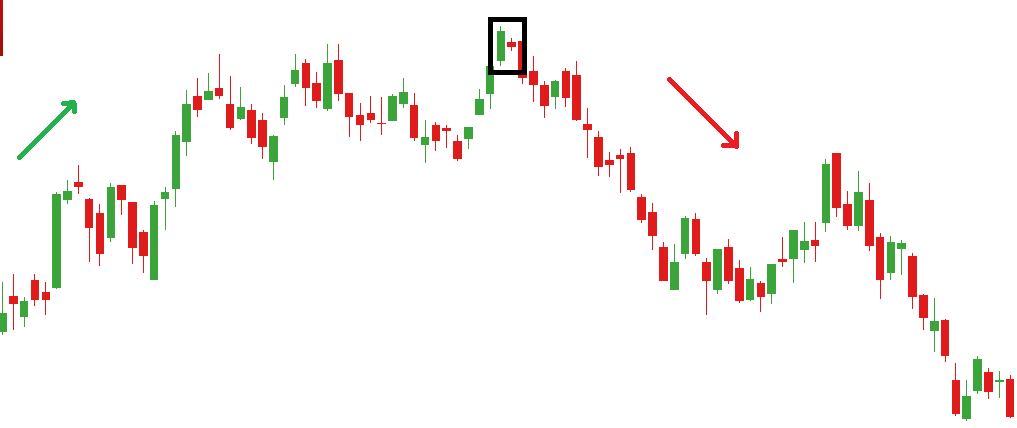
At this time, the market sentiment is bullish as the traders feel that the prices will increase. As a result, the buying pressure on the security increases. The candles close at a bullish trend only.
However, this price increase generates a sense of fear within the traders who are holding that security. They feel that the trend might reverse soon, leading to a fall in the prices.
As a result, the next candle opens at a price lower than the previous closing price and closes in red. There are two most crucial things to be noted in this red candle:
The entire body of this red candle should be confined within the price range of the previous green candle so that the red candle is formed somewhere in the center of the previous candle.
The body of the second candle plays a very crucial role. A smaller body represents less movement in the price, while a bigger body represents a bigger move.
Therefore, if the body is small, one must become cautious as it indicates a higher chance of a trend reversal.
On the other hand, a bigger body is still a harami pattern, but the chances of trend reversal are lesser in this case.
As soon as the bearish harami pattern is formed, traders become cautious, and the bearish sentiment takes over.
As a result, more traders shift towards selling their securities, which leads to a trend reversal.
How to trade using Bearish Harami Candlestick Chart?
Trading isn’t easy and involves a lot of risks. Therefore it is always recommended not to trade simply by observing a pattern.
As mentioned earlier, the candlesticks are just a visual representation of the price, and one can never be 100% sure if the pattern formed will work accurately.
So it is always recommended to consider all major factors and formulate a strategy before entering into a trade.
Also, a strategy that is not back tested is simply not worth it. It’s because you have no idea if it is going to work in the live market or not.
Therefore, your capital is still at risk. The best way to minimize the risk while trading is back testing your strategy before applying it.
There is no sure shot strategy for making money in the market every time. One needs to take care of all the factors while trading.
That said, keeping the following pointers in your mind while trading can help you out.
Every market performs differently in every season
If you’re thinking that formulating a strategy for a bearish harami pattern in the equity market will make you money in the commodity market as well, you might be wrong here.
This is because all financial markets are different in their sense, and they might respond differently.
Also, a market might perform fairly well during a particular season while it may remain stagnant in another season.
The range and size of the candles formed plays a crucial role
As mentioned earlier, the second candle size can help you judge the accuracy of the pattern and the chances of a price drop.
The range of candles gives you a better idea as to what the traders in the market are doing, i.e., buying or selling.
However, there can be some confusing situations where you need to stay cautious. For instance, the first green candle formed is a big one indicating that the security represents an exhaustion move.
This means that the stock has moved a lot in terms of the price. On the other hand, the second candle formed is a small one.
In such situations, the market is a bit hesitant, and the traders have no clue what might happen next.
Find other important Candlestick Patterns here
Frequently used Indicators in Bearish Harami Pattern
As mentioned earlier, there are no sure short strategies that make help you earn guaranteed returns.
However, trading with the use of the below-mentioned indicators can help you make your trades more accurate:
ADX:
The average directional index, aka ADX, is one of the best indicators for judging the volatility in the market.
With the use of ADX, the traders can identify the strong trends that are being formed in the market. The two parameters to be checked in ADX are the period and points.
For instance, you set the scale on ten periods and observe an ADX of 25 points in a bearish harami pattern.
A 25 points ADX represents higher volatility in the market. As a result, it gives you an indication to go short on the security, which forms the above pattern.
Bollinger Bands:
Like ADX, the Bollinger band also gives you an idea about the market’s volatility. However, the technique used here is obviously different.
A Bollinger band is formed using three major components: moving average, upper band, and lower band.
These upper and lower bands are two standard deviations away from the center, i.e., the moving average.
Trading a bearish harami pattern using a Bollinger band is quite simple. Since we are looking for a downward move here, we enter a trade when the security is overbought.
This can be identified using the upper Bollinger band as the Bollinger bands adjust according to the volatility in the market.
If the price of a security moves above the upper Bollinger band, it represents that it is overbought, and one can go short on the security.
Conclusion: Bearish Harami Candlestick Pattern
The patterns formed while analyzing the candlesticks might not tell you the future price of security accurately.
However, with the help of analysis, you can build your own strategies and backtest them to earn profits in the market.
Let us now take a look at what we learned about the bearish harami pattern:
- The pattern got its name from the Japanese term Harami which means pregnant. The pattern got this name as it represents a pregnant woman in terms of appearance.
- The bearish harami pattern is formed during an uptrend when a big green candle coincides with a red candle after its formation.
- The ADX, i.e., average directional index, can be used while trading in a bearish harami pattern to judge the volatility in the market. A higher ADX will represent higher volatility.
- Another indicator that can be used for judging volatility is the Bollinger band. The three components here are moving average, upper band, and lower band. While going short on the security, you need to analyze the upper band. If the price crosses the upper band, the security is overbought and gives you an indication to go short on it.
Open Demat Account in 10 Min & Start Trading Now!
Learn everything about Technical Analysis
| Learn Technical Analysis |
| How to Start Technical Analysis? |
| Best Intraday Indicators |
| Types of Technical Charts |
| Know about Resistance & Support |
| Dow Theory |
| Fibonacci Retracement |