Learn about Multiple Candlestick Pattern – Engulfing Pattern, Dark Cloud Cover & more
Last Updated Date: Aug 30, 2023To study and analyze the trading behavior of the stock, multiple candlestick patterns are one of the most efficient approaches.
Below stated are some multiple candlestick patterns discussed for a better understanding.
About Multiple Candlestick Pattern
This is a Candlestick Pattern used by many traders as an indicator of shares performance & movement.
Multiple Candlestick Pattern evolves over a short period of time generally after 2 more trading days.
This candlestick pattern consists of many patterns like engulfing pattern, Dark Cloud Cover, Morning Star & many more.
Check out the List of Top Multiple Candlestick Patterns here –
| SI No. | Multiple Candlestick Pattern |
| 1 | Engulfing Pattern |
| 2 | Presence of Doji |
| 3 | Piercing Pattern |
| 4 | Dark Cloud Cover |
| 5 | Harami Pattern |
| 6 | Gaps Pattern |
| 7 | Morning Star |
| 8 | Evening Star |
Open a Demat Account Now! – Start Trading
Engulfing Pattern – Multiple Candlestick Pattern
The engulfing pattern is the first amongst the multiple candlestick patterns. It consists of two successive candlesticks where the second candlestick is larger than the first and therefore engulfs it completely.
The smaller candle represents the day one and the larger one represents the day two. The second candlestick is comparatively longer without a shadow.
During the downward trend, if the candlestick becomes smaller then it represents that the sellers are slowly and with time withdrawing from the market.
The engulf pattern happens in two trading sessions. On day one there is a smaller candle, and then on day two, there is a larger candle which seems to engulf the smaller candle.
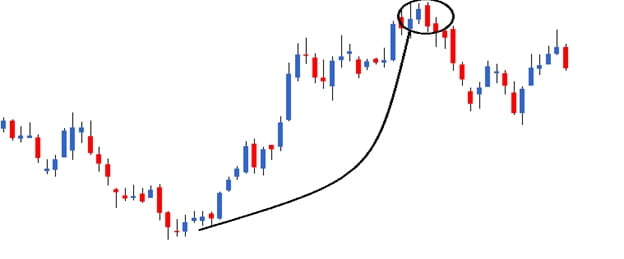
If the traders see the engulf pattern taking place at the bottom of the trend then they can call it a bullish engulfing pattern, whereas if the pattern appears at the top of the trend, then it can be termed as the bearish engulf pattern.
Learn everything about Technical Analysis & make for money in stock market
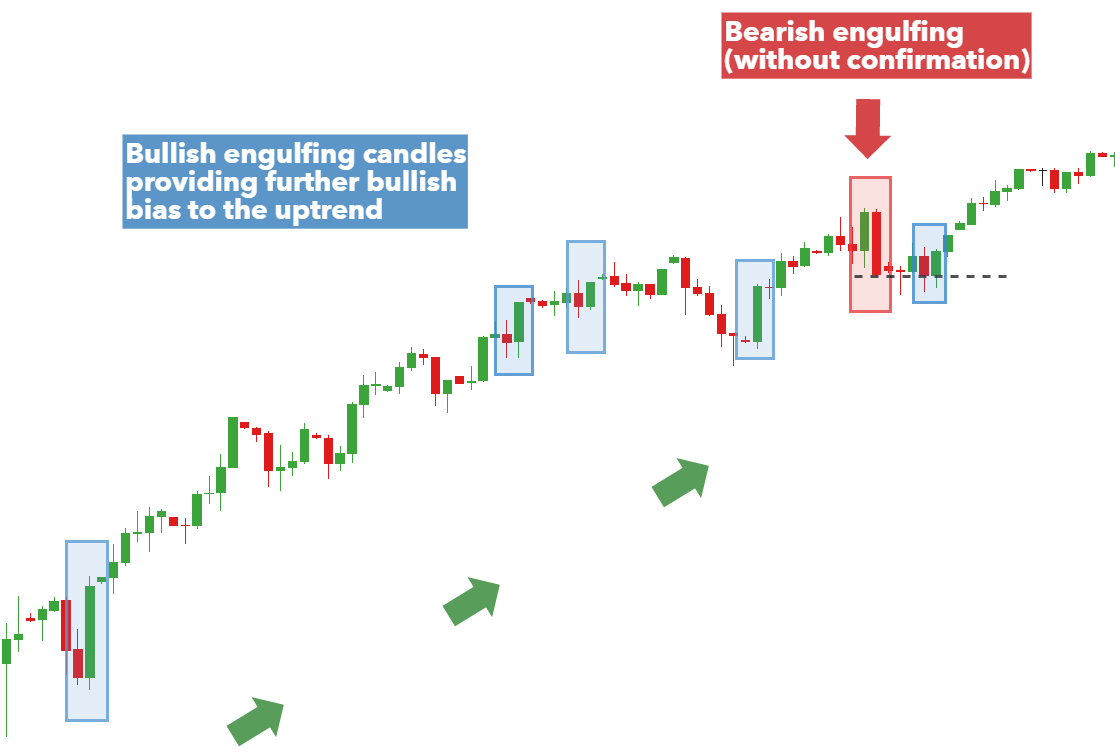
Bullish Engulfing Pattern
The bullish engulfing pattern appears at the bottom of the trend. It is a two candlestick pattern.
The first candle which is red in color will show the bearishness in the market and on the second day, the candle will be big enough to engulf the smaller candle. This will be a blue color candle.
The market is particularly a downward moving market with a downward trend. The red candle which is smaller opens low in the market.
Even the second day, the candlestick opens with the closing price of the last day, thereby setting a new low.
Now, this will suddenly build the buying interest of the traders which subsequently results in the blue candle to close at a higher price.
The long blue candle suggests the bearish market breaking through into the bullish. And so the bullish market is continued for a few trading sessions, indicating the buyers for a profitable trade.
Generally, it takes two days for a bullish engulfing market to evolve. The traders should prefer buying the stock at the closing price of the blue candle.
The investors who are risk-takers are seen to trade on that day itself when a blue candle is formed.
But, the risk-averse investors to wait for a day after the blue candle appears and makes sure that a bullish market has evolved, then only starts to trade.
If on the second day the candle turns red then the risk-averse investors ignore the trade and don’t intend to invest anymore.
Example of the Bullish Engulfing Pattern
For example, the LIC trade opens at the red candle day for 163, with a low of 159 and a high of 168. And then closes at 160.
The second day of the blue candle day, it opens at 159.5 with a high of 170.2, low of 159 and closes at 169.
In this case, the risk-averse will trade at 169 on the second day of the blue candle. The risk-taker investor can verify it by seeing the pattern engulfing the red candle.
Whereas, the risk-averse investor waits for a day and sees whether the blue candle continues and then starts their trade.
Bearish Engulfing Pattern
This candlestick pattern also has two candles but it appears at the top end of the trend, unlike the bullish pattern. Here, the first candle tends to imply an upward moving market with higher prices and a bullish trend.
The second candle after the bullish candle tries to maintain the high but closes low as the sellers undergo the selling pressure at a high point.
Then the seller pushes the prices so low that it closes below the first candle day giving a long red candle, exactly opposite to that of the bullish market.
This situation suggests the bears have broken the stronghold of the bulls and therefore the market will experience low for some time.
The risk-taker investors trade on the same day after quantifying and verifying the pattern to be a bearish engulfing pattern.
And the risk-averse investor will as usually wait for a day to make sure of the pattern and then initiate a trade.
For an example, let’s take a pattern of the ACC cement. At the first day, it opens at 214, low at 213.3, high at 220 and closes at 218.27.
At the second day, it opens at 220, high at 221, low at 2017.3 and closes at 209.4.
The risk taker will initiate a trade at 209 on the second day validating the pattern to be a bearish one.
Whereas the risk-averse investor will wait for a day and make sure of a red candle day and then start to trade.
The Presence of Doji – Multiple Candlestick Pattern
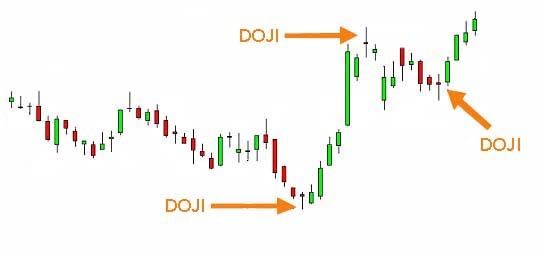
A presence of doji in the chart claims that the bulls have absolute control over the market and the chart shows a prolonged upward trend.
On the first day, a blue candle is formed confirming a stronghold of bulls in the market.
Then the second day, the prices open at a high price, but a higher surge on the selling brings down the price below the first day’s opening price.
This creates panic amongst the bullish investors and then on the third day the market closes flat forming a Doji.
Piercing Pattern
The piercing is a minor difference, where we can see in the bullish pattern has engulfed the red candle completely on the second, but in the piercing pattern the candle on the second does not engulf the red candle completely but at a range from 50% to below 100%.
For example, if on the first day, the difference between the open and close is 20, then, the candle range on the second day will at least be 10, but below 20.
Dark Cloud Cover
Similarly, the dark cloud cover is quite similar to the bearish engulfing pattern.
There is a minor difference, in the bearish pattern the red candle on the second day engulfs the blue candle on the first day completely, whereas, in the dark cloud cover, the red candle does not engulf completely but between 50% and below 100%.
Apart from this difference, it is the same as the bearish engulfing pattern.
Harami Pattern – Multiple Candlestick Pattern
Harami pattern is also a two candle pattern like the engulf pattern. In this case, it is opposite to that of engulfing as the harami pattern has the first candle usually long and the second candle to be smaller.
A trend reversal can be expected out of this pattern. There are two types of harami patterns being discussed below, namely the bullish harami and the bearish one.
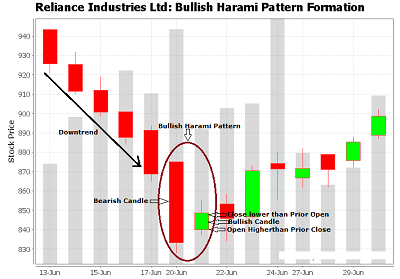
The Bullish Harami
Just like the engulf pattern, the bullish harami pattern works on over two days and appears at the bottom end of the chart.
A downward trend is observed in the market where the bears are having control on the market. On the first day, a red candle is formed, reinstating the bears hold on the market.
On day two the prices open at a higher price creating panic amongst the bears and manage to close off positive with a small blue candle.
The blue candle encourages the bullish traders and shakes the bearish one’s even if the blue candle is much smaller than the red candle on the first day.
This is expected to create panic amongst the bears and gives an opportunity to the bulls to take the market.
The Bearish Harami
This is opposite to the Bullish Harami pattern; it appears at the top end showing an uptrend in the market where bulls have absolute control.
On the first day, the blue candle is long enough reconfirming bulls hold by even opening and closing the market at a positive note.
On the second day, the market opens lower bringing panic amongst the bulls and thus manages to close negatively by forming a small red candle. This unexpected drift brings an opportunity for short trade among the bearish investors.
The risk-averse investor will as usual wait for a day after the second day verifying the red candle in the coming days even.
Whereas the risk taker will short the market as the market closes on the second day ensuing a formation of a harami market.
Gaps Pattern – Multiple Candlestick Pattern
The main Multiple candlestick patterns in consideration are the morning star and the evening star. Gap up and gap down are two important terms connected to this.
Gaps commonly refer to price behavior. When a gap is present in the chart, it signifies that the stock closes at one price but opens at another one the next day.
Gap up opening
This signifies the excitement of the buyer in buying a stock at a price higher than the close of the previous day. Thus, the stock will open above the close of previous day.
For example, let the closing price of ABC Ltd. be Rs. 100 on Monday. Consider that they announce their quarterly results after the close.
On Tuesday, the number is so exciting that the buyers buy the stock at any price. This can help the stock price reach Rs. 104 even in the absence of any trading activity between Rs. 100 and Rs. 104.
This signifies a gap up opening and shows a bullish trend.
Gap down opening
This shows the enthusiasm of the bears in the trade. Due to this, the trade sells at a price lower than the previous day’s close.
In the previous example, if the company had a poor quarterly result, the sellers would be ready to give up the stick at any cost.
Thus on Tuesday, the trade would open directly at Rs. 95 than Rs. 100. This shows a bearish movement from Rs. 100 to Rs. 95 without any trade.
Morning Star Candlestick Pattern
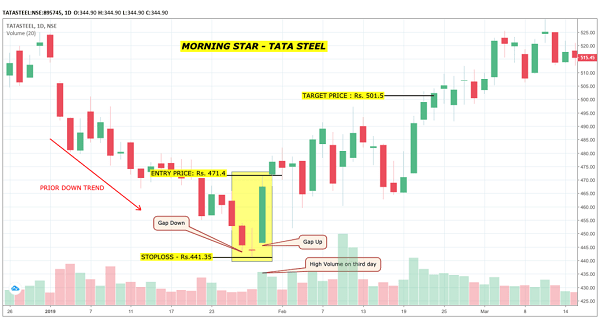
The morning star represents a bullish candlestick stick which forms over a three day period. This shows a downtrend reversal pattern which happens by the combination of 3 consecutive candlesticks.
We can find it at the bottom end of a downtrend. The three candlesticks of the morning star is sequenced in a particular pattern. The process can be explained as follows.
The market would be in a downtrend with the bears in control. There are successive lows at this time.
On the first day of the pattern, there would be a new low which forms a long red candle indicating acceleration.
On the second day, there would a gap down opening. This illustrates the position of the bears. The day might give a Doji or spinning top due to the indecision of the market.
The third day would be characterized by a market opening with a gap up followed by a blue candle closing above P1’s red candle.
Without the Doji or spinning top, the P1and P3 would appear to form a bullish engulfing pattern.
We can see the trading activity mainly on the third day, P3. With the assistance of the gap up on the third day, we could recover much loss of P1.
We expect that the bullishness on P3 would continue to achieve trading sessions. It could bring more buying opportunities.
Here, the risk-taker and the risk-averse trader have a chance of starting to trade in P3.
Evening Star
The Evening star represents the bearish counterpart of the morning star. Likewise, we would find it at the top end of the uptrend.
Similar to the morning star, the evening star also evolves out of three candlestick formation from three trading sessions.
A trader finds a number of reasons to use the Evening Star. The process for the patterns would be as follows.
The market would initially be in an uptrend pattern with the bulls in total control. For every trade, there would be new highs for the stocks.
On the first day of the candlestick formation, the market would open new high and close at new high point of the day.
The long blue candle of this day would illustrate the buying acceleration. On the second day of the formation, there would be a gap on the opening. This shows the presence of bulls.
At the same time, the stock would not move after opening and closing with the formation of a Doji or spinning top. This would set the bulls in a frenzy.
Multiple Candlestick Pattern – Conclusion
On the third day, the market would open with gaps down which gradually forms a red candle. The long red candle demonstrates that there is control in the hands of the sellers.
We expect that the bull would have an increased panic. It would help the bearish pattern to follow for the upcoming trading sessions.
Thus, one can be in the lookout for short opportunities.
Open a Demat Account Now! – Start Trading in Futures
Most Read Articles