Fibonacci Retracement – How it works, How to use it, Example & more
Last Updated Date: Nov 17, 2022Fibonacci Retracement is a technical indicator used by top technical analyst. This is derived from Fibonacci numbers or sequence which helps in determining the support and resistance levels.
Stock prices’ position always remains unpredictable; they suddenly slop upwards and form trends and suddenly bound back, creating opportunities to buy or earn the loss.
Moves indicating trends are identified as impulses, whereas movements against trends are identified as pullbacks.
However, it usually becomes a tricky situation among traders. That’s why they bring the Fibonacci retracement level into action.
It’s one of the widely used tools among traders, which helps them determine the stop-loss levels, place entry order, and set price targets. Moreover, these retracement levels often ensure resistance and support levels for stocks.
Fibonacci retracement levels highlight the areas where the pullback is likely to reverse and create headway to the trending direction.
Altogether, Fibonacci Retracements is the best tool for investors in getting familiar with the trend-trading entry points.
What is Fibonacci Retracement?
The Fibonacci Retracements was primarily introduced to evaluate the population growth of rabbits.
The whole concept was designed by Italian Mathematician Fibonacci (often recognized as Leonardo of Pisa or Leonardo Bonacci).
Still, over time, it has become one of the sought-after concepts being widely utilized in Mathematics and trading.
If we briefly talk about Fibonacci Retracement, it’s a method used by traders for technical analysis that determines the support and resistance levels of stock. However, Fibonacci Retracement is named after the Fibonacci Sequence series utilization.
The overall concept revolves around retracing a predictable portion of a move. And later on, the market starts moving in the original direction.
Similarly, in this article, we’ll put together the entire information highlighting the Fibonacci implication on trading, what is Fibonacci Series, and how to use Fibonacci while trading.
So let’s dive into the article and understand it more deeply.
All details of Fibonacci Series
In order to have a clear idea about Fibonacci Retracements, you should have an understanding of the Series.
This sequence came into existence very early, that is, in the 6th century AD. It came into light with a discovery by Indian mathematicians.
Nevertheless, it was introduced in the west by Fibonacci, who we also recognize as Leonardo Bonacci. In mathematics, we generally denote the series with F (0).
It is a series of numbers that start from 0 (zero) and are in a manner that any number from the series is equal to the results of the last two numbers from the series.
The first two terms of the series are 0 and 1 by convention. When it comes to the Fibonacci sequence, one can notice that,
21 = 13 + 8
233 = 144 + 89
987 = 610 + 377
The series, however, ends to infinity. There’s something special about the Fibonacci Series.
By dividing any number of the series from the previous number, one will always get an approximate value of 1.618.
Further Explanation on Fibonacci Retracements
Here are few examples which can help you understand how Fibonacci retracement works.
21/13 = 1.618
55/34 = 1.618
144/89 = 1.618
This ratio is what we call the Golden Ratio. We know it as Phi. The experts believe that these numbers have a sort of connection to the planet.
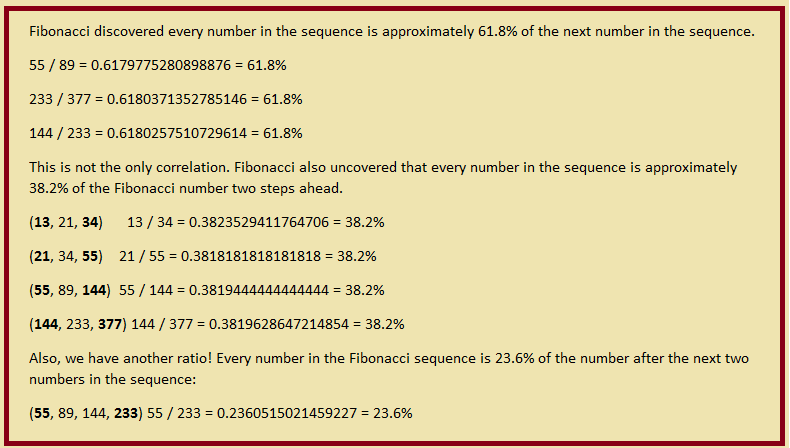
Further, when one divides a Fibonacci number with its succeeding number, one always gets a constant number, that is, 0.618.
For Example:
5/8 = 0.618
13/21 = 0.618
34/55 = 0.618
In case we try to represent it as a percentage, it is 61.8 percentage.
We can find the same when we divide a number from the Series by a number that is 2 places higher than that.
For Example,
2/5 = 0.318
5/13 = 0.318
13/34 = 0.318
In case it is represented as a percentage, it is 31.8%.
We can find the same when we divide a number from the Fibonacci Series by a number that is 3 places higher than that.
For Example:
1/3 = 0.236
2/8 = 0.236
13/55 = 0.236
21/89 = 0.236
In case we try to represent it as a percentage, it is 23.6%.
Open Demat Account in 10 Min & Start Trading Now!
Fibonacci Ratios
As you can see, the volume in each Sea Shell part matches the number sequence of the Fibonacci. Similarly, you find the 61.8 percent part of this shell, a part of the next shell.
However, this ratio isn’t just representing a mathematical term. But you can find this ratio everywhere. Human eyes consider objects more attractive and attention-grabbing that represents the Fibonacci ratio.
However, if we take big companies (such as Apple or Toyota) logo as an example, you’ll discover that all are based on the Fibonacci Ratio.
The implication of Fibonacci on Trading
It’s one of the most notable points about the Fibonacci series – 61.8%, 23.6%, and 38.25% that you find their impactful presence across the entire charts while evaluating a company’s share prices.
Simultaneously, whenever a trader finds movements in the share’s costs, the Fibonacci series is applied regularly irrespective of time frames.
However, it’s also deemed that the price of a company’s shares never moves in a constant direction. Indeed, these prices move in a zig-zag pattern.
Relevance of Fibonacci Ratios to Stock Markets
Fibonacci analysis is something that we can implement when we see a detectable change in prices. The change can either be a shift up or a shift down.
It has been observed that whenever there is a sharp rise or a sharp fall, the stock tends to backtrack before it goes back up or down again.
For instance, if the price of the stock has gone up from INR 80 to INR 160, then chances are that it may backtrack to almost INR 100 before it can go up again to INR 180.
There is a technique, known as ‘The retracement level prediction’. A person can use this in order to trace the level up to which the retracement is bound to happen.
These levels of retracement give a very good chance for the investors to search and set foot in new spots in the line of the trend.
The ratios, that is, 61.8%, 38.2%, 23.6% aid the investors to look for the practicable level up to which the retracement can happen. The investor can position himself according to these levels.
Learn everything about Technical Analysis & make for money in stock market
How Fibonacci Retracement Works?
We will understand it with the help of an example.
A stock is priced at INR 350 and it goes up to INR 450. The shift up of INR 100 is known as Fibonacci up-move.
Considering the Retracement Theory, after the shift up has happened, one can possibly predict a rectification in the stock.
The prediction is that the stock would follow Fibonacci Ratios.
Let us consider, the first level would be 23.6%. In case it continues to go up, investors can notice it going up to 38.2% and then 61.8% extents.
Now, the total up-move is INR 100.
61.8% up-move = 61.8 * 100 = INR 61.80.
Retracement at 61.8% = INR 450 – INR 61.8 = INR 388.20.
Fibonacci Retracement – Movement against the Trend
The movement against the trends here is called a Fibonacci retracement. In order to utilize the Fibonacci retracements, one needs to trace the 100% Fibonacci move in the first step.
That 100% move can either be a shift up or a shift down. In order to trace the 100% Fibonacci move, one needs to choose the latest peak and trough which is shown on a chart.
Once that is pointed out, one can easily join them with the help of a retracement tool. One can also refer to the following guide that details the procedure step by step.
- The first step s to trace the latest peak and trough.
- The second step is to select the retracement tool.
- Using the Retracement Tool, connect the peaks and the troughs.
- After the trader has selected the tool, he needs to tap on the trough initially, and he does not have to tap it. Rather, he has to drag it till the peak. Also, the software retraces it only after the process of connecting all the troughs and peaks has been completed.
Why is the Fibonacci Retracement Indicator useful for Traders?
The Fibonacci Retracement for several decades has been considered as the underlying method used in Finance.
However, you can also call Fibonacci retracement a technical analysis tool, which works as a predictive technical indicator.
This is due to this tool’s trait, which forecasts future events in the market and unleashes the best entry point, especially when there are pullbacks signals. It has the potential to provide a profitable result to the traders.
Although, like other tools, it isn’t necessary that you fully start relying on Fibonacci retracement and come across the decision.
For instance, like other tools, it doesn’t provide you with a complete picture of the market; still, it works best to identify various market situations.
Thus, there’s nothing wrong with calling it the best trading strategy. Also, it helps a trader in making long-term decisions.
How to trade using Fibonacci Retracements?
The concept of Fibonacci retracement is most commonly brought into action as a part of the trend-trading strategy. Such as, stocks can pullback before reverse occurs in the previous movements.
Therefore, the retracing of stocks should be done as soon as possible, so a trader can think about implementing the Fibonacci levels on time to get an idea about the forthcoming reversal that is likely to come.
However, it isn’t essential that the ‘price movement’ stays constant at the beginning or at the end; indeed, it can be distinctly spotted.
That’s why the Fibonacci tools come ahead as the best solution for the traders to evaluate their moves’ distance. The placing of the retracement level is also automatically done.
Similarly, once it approaches these levels, a trader can expect that the trend is likely to pull back and reverse or continue its movements conversely.
As compared to regular, these reversals around Fibonacci Retracement levels tend to occur more frequently.
In a downtrend, this strategy assists traders in determining the best short-selling positions. On the other hand, in an uptrend, the strategy can trigger a great buying opportunity.
In particular, the Fibonacci trading strategy can be effectively utilized across different financial instruments, e.g., forex pairs, commodities stocks, and indices.
The retracement levels truly help provide a comprehensive idea to the traders, e.g., whether to choose an asset for the long term or short term.
Strong Uptrend
If a trader wants to detect a strong trend with Fibonacci, he will briefly measure the pullback of the security.
On the other hand, if they observe new highs in the series with retracements of 50% or less, then it’s an indication of a strong uptrend.
Fibonacci Retracement + Support & Resistance
Among traders, the use of Fibonacci Retracement is quite famous when it comes to spotting the potential support and resistance levels.
Traders strive to measure these support and resistance levels, whether they are lined up with retracement levels or not.
The probabilities of price bouncing are high compared to higher highs if the Fibonacci levels are already lined up with the support and resistance level.
You also try to combine these levels with other price areas that are favorably viewed by other traders.
In the USD/CHF chart below, you can find how a trader with Fibonacci can adjoin the support and resistance levels.
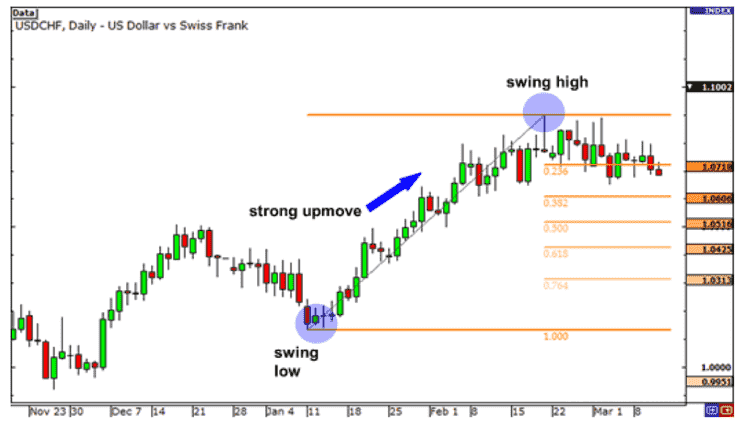
The chart above shows the uptrend (green signals).
Similarly, a trader settles on to get on the USD/CHF bandwagon.
But, “what will be the best time to enter?” is a questionable subject.
While using low at 1.0132 for the ‘Swing low’ (On January 11) and high at 1.0899 for ‘Swing High’ (on February 19), a trader bust out a retracement tool.
Through this framework, a trader can disclose the possibilities of solid entry, indicating the best position to enter.
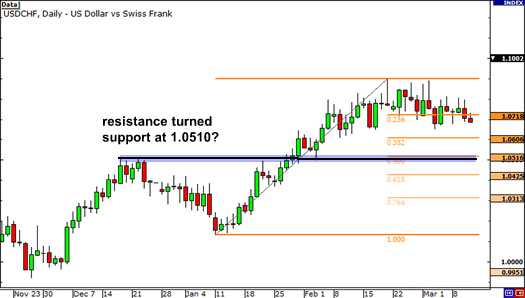
Furthermore, if you glance back at the 1.0510 price tag, you’ll discover a good resistance level, which lines up with the Fibonacci Retracement Level near about 50%.
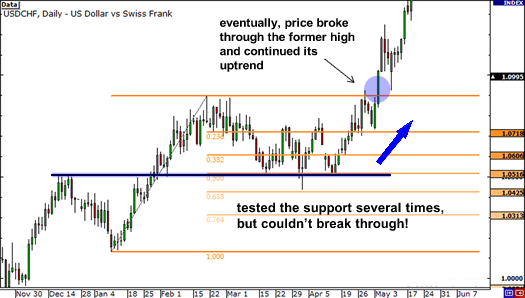
This chart indicates the right place to buy; you can see the price broke, which is likely to turn into support.
Although a trader also had to go through a pretty tensed moment, particularly at the support level on April 1, the price tried to break through the support level.
Still, it couldn’t be successful and eventually failed to close below it. But in the end, the pair resumes its uptrend.
How to use Fibonacci Ratios?
There have been certain situations and circumstances where no matter how much a trader wanted to purchase a specific stock; he couldn’t due to a shift up in the stock.
In case someone is stuck in a similar situation, they need to wait for the perfect situation when the stock would retrace back.
The retracement levels are about the stock acting to a potential level of improvement and it is for the expert traders to understand.
By representing these particular retracement levels on the graph, the trader can trace these levels, and consequently, position himself in order to grab the space to go into the trade.
Just like any other indicator, the Fibonacci retracement acts as a tool. However, one’s stance to purchase would be greater in case the stock has:
- Made an identifiable candlestick design.
- The stop loss clashes with the S&R level
- The volumes are surpassing average.
Fibonacci Retracement Pros and Cons
It’s true that ‘Fibonacci Retracement’ has lots of things in its pros side, but you shouldn’t overlook the conceptual and technical shortcomings indicating the cons side of the Fibonacci Retracement.
Similarly, it alerts the trader to utilize the Fibonacci Retracement carefully. Just like other analysis tools, Fibonacci retracement is also subjective.
Traders often use Fibonacci retracement in numerous ways. However, those traders who use this technical analysis tool and earned profits in most instances describe its effectiveness.
On the other hand, those traders who’ve earned loss through it often describe it as an unreliable tool. Although, if we talk about turning points, Fibonacci Levels never suggest the exact pinpoints.
It solely provides the trader with an estimate of the entry area irrespective of the exact entry points. That’s why it’s difficult to predict whether the price will reverse or stop at a particular level.
If a trader is willing to use the Fibonacci Retracement tool at small price moves, a trader will only get disappointment in hand.
Also, this tool struggles to identify easily identifiable weak or strong signals. Still, this tool can help traders at Pullbacks by providing them confirmation signals if there’re great trading chances.
In a nutshell, Fibonacci Retracement can point to potential corrections, countertrend bounces, and reversals.
So this was all about Fibonacci retracement levels and how you can apply them as well right to your charts for market analysis.
Fibonacci Retracement – Conclusion
The series can be the fundamental Concept for a complete retracement procedure and in order for the trader to understand the retracement levels, it is vital to understand how this series works.
We can see that this series will have a lot of mathematical interference in itself. These properties, as the experts say, connect to nature and its balance itself.
The traders and investors believe that this series will have particular implementations when it comes to stock charts. It happens because many traders are able to actually trace the retracement level with the help of this presentation.
The retracement can work on multiple extensive before it gets back to an original position. As discussed earlier, the extent could either be 61.8, 38.2, 23.6 accordingly.
When we see at the retracement level, the trader can lookout for a new trade. Especially, in these cases, he should authenticate the rest of the points present on the checklist.
Overall, it is mandatory to have a basic understanding of this concept before proceeding any further.
Open Demat Account in 10 Min & Start Trading Now!
Most Read Articles