Doji Candlestick Pattern – Meaning, Significance, Formation, Types, Limitation & more
Last Updated Date: Aug 30, 2023Doji Candlestick Pattern is also known as the Doji star, and it is also a part of the candlestick patterns. In the world of trading, it is one of the unique formations.
This pattern is mainly formed when the opening price of the security is equal to its closing price. It indicates mostly the equality or indecisiveness among the bulls and bears.
Often, you can see the Doji Candlestick pattern at the bottom of trends, and it is mainly considered as a sign of possible reversal of price direction.
Additionally, a Doji candlestick pattern is primarily viewed as a continuation pattern. Before you learn trading with Doji candlestick pattern, it would be great if you knew some basics.
About Doji Candlestick Pattern
Ideally, Doji is a name for a specific session under which the candlestick of stock has both an open and close that are equal virtually and are also form the part of elements in the patterns.
You can quickly identify Doji candlesticks pattern as they appear as a cross, plus sign or an inverted cross.
When Doji candlestick pattern is isolated, they tend to be formed as neutral patterns that are also included in the list of basic patterns.
Experts state that the Doji candlestick pattern is mainly formed when the stock’s opening and closing price are same virtually for a specific duration and generally it indicates the reversal in the pattern for technical analysis.
Doji in Japanese ideally means a mistake or a blunder. It refers to the rarity of having the open and close price at the same time.
The vertical line of the Doji pattern is known as the wick; on the other hand, the horizontal line is known as the body.
The length of the wick mostly varies as the top primarily represents the highest price, while the lowest price is illustrated at the bottom.
Mainly the difference between the opening and closing price is represented by the body. Even though the length varies, but the width remains the same always.
It is also said that the Doji Candlestick pattern leads to higher profit margins in trading. All the traders irrespective of the timeframes tend to appreciate the versatility of the candlestick pattern.
Open Demat Account in 10 Min & Start Trading Now!
What does the Doji Candlestick pattern tell traders?
One thing that almost all trading experts believe in is that all the information is reflected in the price of the security. By this saying, all we mean is that the price is efficient.
The past performance price is yet nowhere related to the future price performance, and the actual price of the stock might have no relation with its intrinsic value.
Thus, technical analysts use tools to help filter through the noise and also to quickly find the highest probability trades.
The candlestick chart is one such tool that was developed back in the 18th century by a Japanese rice trader Homma who belonged to the town of Sakata.
Much later in the 1990s the tool was recognized by Steve Nison. Each candlestick pattern tends to feature four sets of data that helps in defining its shape.
Analysts mainly make assumptions about the price behavior based on this shape. Every candlestick is based on the high, low and close.
Usually, the time period doesn’t have any significant influence. Doji is said to be referring to be both plural and singular form, and it mainly represents the indecision of both buyers and sellers.
Above all, it can be the time when either buyers or sellers gain momentum for a continuous trend. Doji candlestick pattern tends to be seen in consolidated periods.
Know about other major Candlestick Patterns
Doji Candlestick Formation
Ideally, a Doji candlestick pattern is formed when the markets open and bullish traders in the market push the prices while the high prices are rejected by the bearish traders, and they push it down again. I
t is also quite possible that the prices are driven down further by the bearish traders.
In simple words, we can say that the markets have explored both the uptrends and downtrends, but it doesn’t rest in any direction for a long time.
When the price closes at higher or lower the same level as it opened the Doji candlestick pattern is formed.
Types of Doji Candlestick Patterns
Here are the various types of Doji Candlestick Chart Formation –
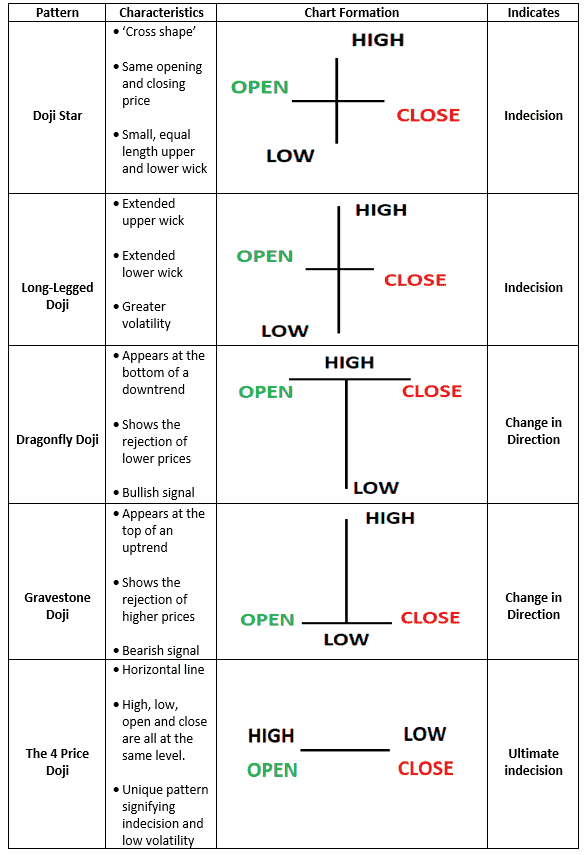
Neutral Doji
One of the most common types of Doji is the neutral Doji, and the pattern occurs when buying and selling are almost the same.
Long-legged Doji pattern
The pattern does fair justice to the name as it is ideally long-legged pattern. The pattern takes place when the supply and demand factors are equilibrium.
The future of the trend’s direction is mainly regulated by the previous trend and the Doji pattern.
Gravestone Doji
When the supply and demand factors are equal, the pattern tends to be formed at the end of an uptrend. The candlestick opens and closes mainly at the day’s lows.
Dragonfly Doji
When the supply and demand factors are at equilibrium, the pattern tends to be formed at the end of the downtrend.
Find other important Candlestick Patterns here
Limitations of using the Doji Candlestick Pattern
When used alone, the Doji Candlestick pattern tends to be a neutral indicator which provides very little information.
Hence, Doji doesn’t occur commonly, so it is not a reliable technical analysis tool for seeing things like price reversals. It is not always reliable when it does happen.
Additionally, you cannot be assured that the price will continue to move in the same direction once the candle is confirmed.
It is also challenging to estimate the potential reward as the candlestick fails to provide any targets.
Conclusion: Doji Candlestick Pattern
It is said that the Doji Candlestick pattern appears when the market’s open and close price is mostly the same, and it indicates neutrality and indecisiveness.
It is mainly formed when the market opens, the prices are pushed by the bullish traders, and the bearish traders push it down again or vice versa.
When you see a Doji Candlestick, you can begin trading using CFD’s or bets.
Open Demat Account in 10 Min & Start Trading Now!
Learn everything about Technical Analysis
| Learn Technical Analysis |
| How to Start Technical Analysis? |
| Best Intraday Indicators |
| Types of Technical Charts |
| Know about Resistance & Support |
| Dow Theory |
| Fibonacci Retracement |