Dow Theory – Know about its Principles, Categories, Patterns & more
Last Updated Date: Nov 16, 2022In the field of Financial Technical Analysis, Dow Theory is considered to be one of the oldest yet widely-appreciated theories.
According to Dow Theory,- the Trend is split into three parts: primary, secondary, and minor.
The Dow Theory proposes that the market is divided into three phases: accumulation phase, panic phase, and public participation phase.
Volume should go proportionately with the Trend.
In today’s trading world, technical analysts bring lots of tools into action to create a market pattern, so they could come across the best buy or sell decision.
But, along with utilizing these tools, analysts undergo an extensive thought-process, which is equally requisite.
For this, technical analysts take help from numerous theories developed by historical trading experts.
Similarly, the Charles Dow theory has been holding a prestigious position for a comprehensive market discussion.
What is it? How it provides insightful information to the traders? Let’s check it out in this article.
History of Dow Theory
Let’s introduce first with the founder of Dow Theory- Charles Dow; he has also been a founder of Dow and Jones company, and also, he has been recognized as the first Editor of Wall Steel Journal.
If we put light on the Dow Theory origin, so basically, this theory revolves around most of the editorials written by Charles Dow in 1900-1902. But after Dow’s death, the work was continued by William Hamilton.
Similarly, after the collective contribution of both Dow and Hamilton, Robert Rhea refined the theory and published the book on it in 1932 named “The Dow Theory.”
Although the Dow Theory was proposed a century ago, the critical information that this ‘theory’ shares in modern financial Technical Analysis is remarkable.
Although the theory was launched to analyze the DJIA and DJTA indices, experts reviewed it repeatedly and found it applicable in other indices. Next, we’ll talk about the actual definition of Dow Theory.
About Dow Theory
Dow Theory is a part of technical analysis that helps the traders in identifying the market trends to generate profits.
In the Dow Theory, traders come to know about the stock market. Such as how investors can get an idea about the business environment through the stock market.
However, it’s the only single theory of its kind that explained the market trends movement very well.
Although the plethora of shifts taking place in the ‘stock market’ overtime, the Dow Theory’s basic tenets are still holding a dominant position.
What are these tenets? Let’s discuss thoroughly.
Open a Demat Account Now! – Start Trading
Basic principles of Dow Theory
The Dow Theory is largely based on the following significant tenets devised by Charles Dow. The major principles are as follows.
The Stock Market Discounts Everything
The first principle of Dow Theory explains how price and indices can describe the market information because before any significant change occurs in the market, it first impacts the stock price and indices.
For instance, this obtained data can include information related to earning announcements made by ‘companies, sentiments of investors, rise or fall in inflammation, etc.
It concludes that instead of taking an overview of a company’s balance sheets or study earning reports, the analysis of price movements can provide you insightful information.
The Market Includes Three Trends
Dow Theory is supposed to be the first-ever theory that proposed the fact that market moves in Trend. Also, these trends split up into three categories:
Primary Trend– It’s the most significant trend for the entire market. The primary Trend indicates the market-moves, especially in the long-term.
Similarly, the duration of primary trends can last for many years.
Secondary Trends- These trends are a kind of corrections made to a primary trend. You can also recall it as the primary Trend’s opposite movement.
For instance- the primary trend slopes upwards (creating a Bullish phase), the secondary Trend slopes downward. But secondary trends last hardly for a few months or sometimes weeks.
Minor Trends-These trends are the fluctuations that occur daily in market movements. The minor trends span for less than a few weeks.
However, minor trends go against the secondary Trend’s movements.
Primary Trend has Three phases of Each Trend
The Dow Theory also reveals another noteworthy point, which says that Primary Trend includes three phases; named.
Accumulation Phase- When the primary trend beginning happens sloping upward (or downward) like bullish (or bearish).
Panic Phase– This phase refers to the time when investors are likely to buy stocks in an extensive amount, which results in significant speculation.
However, for investors, it becomes vital to book profits and exit as soon as possible.
Public Participation Phase- In this phase, more investors are likely to enter the market as the improvements become visible across business conditions.
Similarly, this also triggers a rise (or decline) in prices in the market.
Market indices must confirm with each other
It is also mentioned in Dow’s Theory that a single index fails to verify a trend in the market. That’s why market averages and indices much confirm each other.
However, it also implies that there should be no discrepancies between the index. Indeed they should be reflecting the same opinion.
For instance- suppose a bullish trend occurs in India; the Sensex, Nifty, Nifty Midcap, Nifty Smallcap alongside other indices are likely to slop upwards.
In the same manner, such as in Bearish Trend, the indices are likely to slop downwards.
Volume Confirmation in Dow Theory
Trading Volume is the deciding element in which direction the market trend is likely to move.
For example- in an Upward Trend, analysts can observe a rise in volume and price proportionately (or decrease).
On the other hand, in a downtrend, analysts can watch the ‘rise in volume with a drop in price and vice versa.’
The Market Trends continue until Clear Signal
According to Dow’s Theory, despite significant noise in the market, the Trend exists.
However, this happens during the instances when there’s an upward trend, the likelihood of temporary trend reversal is high, but in addition to this situation, the market is likely to stay in an upward direction.
Altogether, an analyst shouldn’t come across the end conclusion until a reversal starts becoming visible in the market.
Significance of Closing Price
Out of the 4 major price levels, open high, low, and close, the closing price is very important as it provides the final state of the overall stocks on a particular day.
The role of Sideways Market
The sideways market trend can effectively take the place of secondary market trends.
Learn everything about Technical Analysis & make for money in stock market
Phases of Market according to Dow Theory
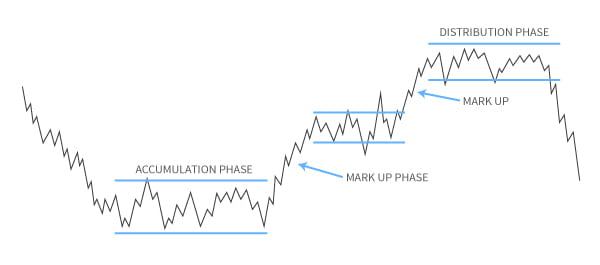
According to this the Dow theory the market trends comprise 3 different phases, the accumulation phase, the markup phase, and the distribution phase.
Accumulation Phase
It is one of the most basic phases usually observed after a huge sell-off when traders would not buy new shares due to the fear of further sell-off situations.
It is the institutional, long-term investors who would buy maximum shares in such a situation, accumulating as many shares as possible.
This phase marks the baseline of the market since these institutional buyers support further price drops by buying shares from all interested sellers.
These institutional investors are sometimes referred to as ‘smart money’ and this phase may last for months.
Mark Up Phase
We can identify the markup phase with an upward trend in the stock price. The price is quick and sharp and once the price reaches its highest value the market starts attracting the public to invest.
This phase attracts public investments and is therefore also referred to as the public participation phase.
Distribution Phase
It is the phase when institutional investors begin to distribute their acquired market shares.
The distribution of shares by the astute investors at regular intervals controls the price from going further higher.
However, selling all the shares further creates a period of a huge sell-off. Therefore, this phase often happens by a new accumulation phase, beginning the cycle once again.
This cycle of phases is often different for different markets and can last for months or even years.
Patterns in Dow Theory
The Dow Theory is a form of technical analysis and various patterns help the analyst and the trader in identifying the possibilities in trading.
The popular Dow Theory patterns include the Double bottom and Double top formation, the triple bottom and top, trading range, and the flag formation.
Each of these patterns is discussed further in the following sections.
The Reverse Patterns
The double and triple patterns are two types of reverse patterns since the stock price recovers and bounces back to the particular levels within a limited time frame.
Double Bottom
Consider a situation when the stock price is at one of its lowest levels, the price may show some significant recovery for a short period of two weeks or more and then drop down again.
This situation creates a double drop pattern in the chart and is referred to as the double bottom pattern. This pattern indicates a bullish trend and traders can profit from buying shares.
Double Top
It happens in a situation when the stock price trends up to a particular level, comes down, and then again bounces back to the top-level within two weeks or more.
The double top pattern indicates a bearish trend and the traders can look for opportunities to sell.
Triple Bottom and Triple Top
These patterns are in the way the double bottom and double top patterns are formed.
The only difference is that in this case, the price level bounces back twice, that is the price hits a particular point thrice.
Range Formation
The market trends may continue to depict the bouncing pattern more than thrice as a result of which the price seems to show a sideways trend.
The sideways trend in the market creates a range within which the price fluctuates and usually this situation is difficult for trading.
However, there are opportunities in this range to generate profits, for which the upper range limit acts as the resistance level and the lower limit the support level.
The range pattern may continue for months or a few years and the width of the range comes by the duration of the pattern.
Stocks exhibit this range pattern or sideways trending market either due to the lack of some basic factors like new announcements, product launches, etc. or during the waiting period of new changes.
However, a change in both these factors can produce a range breakout with high volumes and a higher rate of price change.
A stop loss is essential while trading using range breakouts. An example of trading in range breakout with the use of stop-loss is as follows,
- Consider the stock in a sideways market, with the price oscillating between Rs.150 and Rs.300.
- Consider the range breakout to be at Rs.300, with the stock trading at Rs.350. In this case, the trader has to keep Rs.300 as the stop loss.
- The minimum price would be Stop loss + range width.
In this case it is, Rs.300 + 150 = Rs.450
Flag Pattern in Dow Theory
A flag pattern happens when the stock price rises sharply follows by a small decline of around 10% (correction). The pattern is what we call a flag formation since it creates a look of the flag on the leg.
The largest benefit of the flag formation is that, it provides the trader an additional opportunity to buy the shares that they might have left out.
This kind of pattern forms as a result of selling too many shares to gain profit, which further leads to a drop in price.
Reward to Risk Ratio (RRR) in Dow Theory
The Reward to Risk Ratio is a general concept in the trading system. Its general relation to the trading makes it important to mention here.
The fundamental benefit of RRR is that it calculates the possible returns during any particular period. Consider the following hypothetical example for better understanding.
- A stock trade enters at Rs.200 with Rs.180 as the stop loss and Rs.230 as the expected target.
- The risk involved is Rs.200 – Rs.180 = Rs.20
- The expected profit is Rs.230 – Rs.200 = Rs.30
- RRR = expected reward/ risk value, therefore RRR, in this case, would be 30/20 = 1.5
- That is, for every Rs.1 risk the trader can expect the benefit of Rs.1.4
The trader analyzes minimum RRR for adjustment analyzing the risks.
Important things to note in Dow Theory
Here are some important things to keep in mind –
Closing Prices and Line Ranges
Charles Dow pays special attention solely to the closing prices irrespective of the index’s intraday movements.
To get a vital insight into the Trend, the closing price first unleashes Trend’s probabilities, irrespective of intraday price movement.
On the other hand, you get another feature describing in Dow Theory, ‘the idea of line ranges’ also known as trading ranges used in technical analysis for further approaches.
These are actually a period of sideways price movements that analysts often view as a consolidation period.
Similarly, a smart trader always waits for price movements that are likely to break the trend line, so coming across the final ‘decision’ appears straightforward.
In short, if the price exceeds the line, the probabilities of a hike in market trends are likely to come.
Signals and Identification of Trends
In the entire Dow’s Theory, the most challenging aspect that most of the traders find hard to implement is trend reversals’ accurate identification.
Bear one thing in mind, an analyst who follows Dow Theory is likely to trade with the market’s direction. Still, it’s crucial that before coming across the final judgment, they identify directional shifts’ points.
Although, the crucial technique that most of the traders use in Dow Theory to get an idea about the trend reversals is peak-through analysis.
So what is it? A ‘peak’ refers to the highest price during the market move; on the other hand, ‘through’ refers to the lowest price during the market move.
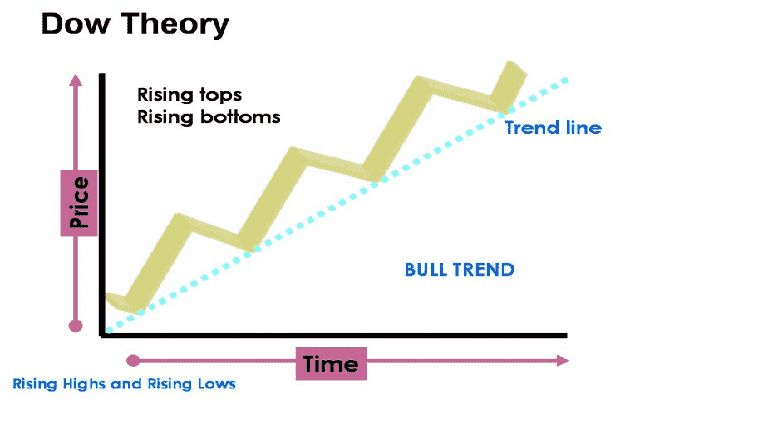
However, Dow’s Theory proposes that the market keeps fluctuating every time and never moves in a straight line.
But the theory believes that from highs to lows, the overall market trend moves in the same direction.
In a nutshell, you can find in Dow Theory; the upward Trend is a series of higher peaks along with higher through moving consecutively.
Meanwhile, the Dow Theory’s sixth tenet shares an opinion that the Trend is likely to stay effective until a clear sign of trend reversal occurs, which is somewhat similar to Newton’s First law of motion ‘an object will continue to move in the same direction until the outer force obstruct that motion.’
Similarly, the market moves continuously in a direction and waits for the change to disturb its position. It can be anything from business conditions to economic changes.
Reversals
If a reversal occurs in the primary Trend, it means that the market has failed to build another consecutive peak and through in the primary Trend’s direction.
However, if we talk about uptrend, the signal of reversal would be a sign of failure of the market that isn’t able to reach a new high or higher low.
However, in such situations, an analyst should know that the market is going through a primary downward trend.
On the other hand, if the market is able to establish a strong peak and as compared to the previous peak, it is much higher, so it indicates the situation of upward Trend.
Role of Dow Theory in the checklist
The Dow Theory has a prominent place in the trading checklist. It helps the trader is looking at the trade from the perspective of the theory.
Moreover, it provides an additional confirmation to begin any trade.
Dow Theory – Conclusion
The Dow Theory is one of the most important theories of technical analysis. It was developed in the late 19th century by Charles Dow and is prominent even today.
The theory has had supporters as well as critics equally over these years. It is completely on the fundamental principles which we have described in this section.
Traders can benefit from the trade by following the trade and interpreting all the distinct patterns involved in it.
Therefore, traders can analyze the trades and the related profits using the Dow Theory.
Open a Demat Account Now! – Start Trading
Most Read Articles