Dark Cloud Cover Candlestick Pattern – Meaning, Formation, Significance & more
Last Updated Date: Nov 16, 2022The Dark Cloud Cover Candlestick Pattern is yet another basic candlestick pattern that you just cannot ignore.
But, before digging in deep about the pattern, we need to learn the basics of the dark cloud cover candlestick pattern.
The dark cloud cover candlestick pattern is termed as the bearish reversal candle pattern that appears at the end of an uptrend.
Potentially, it shows the weakness in the uptrend. The pattern consists of two candlesticks, where the first one is bullish while the second one is bearish.
The bearish candlestick of the second one mostly signals the trend reversal and also it reveals the end of the uptrend. The candlestick pattern is mainly similar to the piercing pattern.
The only significant difference here is that piercing pattern appears at the end of the downtrend; on the other hand, dark cloud occurs at the end of the uptrend.
About Dark Cloud Cover Candlestick Pattern
The dark cloud cover candlestick features a large black candle forming a dark cloud over the last day’s candle.
The buyers tend to push the price more than the previous open, but then the sellers manage to dominate in the next session and push down the prices further.
When the shift appears from buying to selling, the price reversal to downside takes place which is most likely to be forthcoming.
Majority of the traders consider that the dark cloud cover candlestick is only useful when it occurs at the end of an uptrend.
The pattern is said to becoming more essential for the reversal to the downside as the prices rise.
The pattern tends to become less significant if the price action is choppy, and the price remains choppy after the formation of this pattern.
Open Demat Account in 10 Min & Start Trading Now!
Indication made by Dark Cloud Cover Pattern
The candlestick pattern is mainly referred to as a pattern under the technical analysis, and it is mostly a bearish reversal signal.
It appears when a down candle opens more than the previous candle’s up and is also most likely to close below the midpoint of the up candle amid the candlestick chart.
As the candlestick pattern serves as the bear signal, it indicates that the existing uptrend might reverse into an upcoming downtrend.
These candlestick charts are price chart that is mostly used in the technical analysis. The candlestick charts tell us about the highs, lows, open and close of a particular stock for a specific situation.
The patterns are taken seriously when they appear after a significant uptrend in prices of a stock.
The pattern is mainly used to indicate when the uptrend might come to an end and is more likely to shift towards a downtrend.
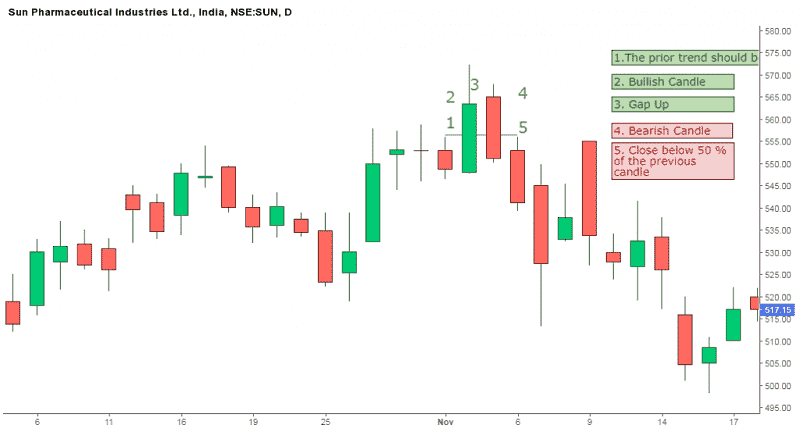
The three stages of the dark cloud cover candlestick pattern include a gap that turns into a down candle. An established uptrend and the down candle is below the midpoint of the last up candle.
The pattern is said to be vital as it shows a significant shift in the momentum towards the downside from the upside.
It is most likely to be formed by an up candle and then followed by the down candle. Traders most likely look for the price to continue to decrease on the third candle, and it is termed as confirmation.
Know about other major Candlestick Patterns
How a Dark Cloud Candlestick Formation looks like?
The dark cloud candlestick pattern is most likely to feature a large black candle which forms a dark cloud before the previous candle.
Just like bearish engulfing pattern, the buyers tend to push the price higher at the open, but at the closing, the sellers dominate the price.
Trader state that this pattern is useful only if the rise in price is seen overall. The pattern is also characterized by white and black candlesticks that feature real long bodies and also have short or no shadows.
By looking at these features, we can say that lower move was not only highly decisive but also crucial with regards to the movement of the price.
In the form of a bearish candle, traders tend to look for confirmation. Following the dark cloud candlestick pattern, the price is most likely to decline so that it doesn’t warn that the pattern might fail.
How to determine Dark Cloud Candlestick Pattern?
You need to know that the dark cloud candlestick pattern is a part of the Japanese candlesticks, and it signals that there might be trend reversal after the frequent rise in price.
When it is seen in the uptrend, the bullish green candle is seen after the red candle.
Though it is relatively easy to spot the dark cloud candlestick pattern if you are new to trading, you might require some practice.
Find other important Candlestick Patterns here
What does Dark Cloud Candlestick Chart convey to traders?
In the uptrend, the sizeable bearish candle occurs, and it tends to open above the last bullish candle.
All it means is that the buyers initially controlled the market, and they have pushed the prices higher, but after this candlestick is formed, the bearish forces rule the market.
Thus, the price is most likely to close below the midpoint of the bullish green candle. Being a bearish indicator, it is valid only if it appears in the uptrend.
It is mandatory for the formed candles to have short bodies. As the candlestick patterns are visual pattern, no calculation takes place ideally.
If the traders plan to exit, then they must rely on other indicators. At times they place a stop loss beyond the high of the bearish candle. An indication of overbuying is RSI being over 70.
Conclusion: Dark Cloud Cover Candlestick Pattern
There are a plethora of signs to confirm the formation of dark cloud candlestick pattern.
In the following day if the traders plan to exit their extended position, then they might consider going at the end of the bearish candle.
If traders plan to enter, then they can place their stop loss mainly above the more significant point of the bearish candle.
Open Demat Account in 10 Min & Start Trading Now!
Learn everything about Technical Analysis
| Learn Technical Analysis |
| How to Start Technical Analysis? |
| Best Intraday Indicators |
| Types of Technical Charts |
| Know about Resistance & Support |
| Dow Theory |
| Fibonacci Retracement |