Piercing Line Candlestick Pattern – Meaning, Example, Benefits & more
Last Updated Date: Nov 17, 2022Usually, an investor will observe the development of a Piercing Line Candlestick Pattern near a support level for security. When this happens, an investor may understand it as a sign of a potential bullish reversal.
This type of pattern usually occurs towards the end of a downtrend and in formation, it is similar to a dark cloud over.
The pattern takes formation through two distinct candles where the first candle appears bearish while the second one will be a bullish candle.
Let us get to know more about a piercing line candlestick pattern in the context of stock market securities.
What is Piercing Line Candlestick Pattern?
As already mentioned, a piercing candlestick pattern occurs during a downtrend and indicates a bullish reversal pattern. For an investor, this is an indication that they may enter a long position now or exit from a sell position.
In more technical terms, we can interpret this as a sign that the pressure of bulls and bears in the market is attempting to gain control of the market movement.
In order to confirm whether two candles are indeed forming this pattern, here are some vital features to look for:
- The first candle should be a bearish candle in red.
- The bearish candle must have a large real body.
- Second candle must be a bullish candle in green.
- The bullish candle should be lower than the bearish candle
- The bullish candle must close at a point which is above the middle point of the bearish candle.
- Both candles must not have an upper or lower shadow.
Open Demat Account in 10 Min & Start Trading Now!
How does Piercing Line Candlestick Pattern looks like?
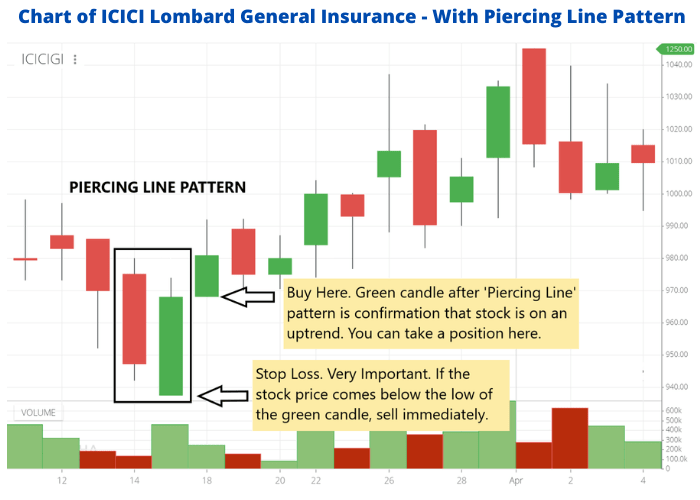
This is an example of what a piercing line candlestick pattern looks like. Here are a few inferences which can be drawn from the image above:
- The market seems to be in a downtrend and while the opening price of the security is high, there continues to be a selling pressure in the market.
- Since the closing price of the security reaches a new bottom, the candle turns red. It also does not have any upper or lower shadow since the highest and lowest price of the security remains within the ambit of the candle.
- The opening price of the security the next day is lower than the opening price on the previous day. Due to the pressure of the bulls, the price of the security keeps rising. Due to their success, the closing price of the security happens to be higher and above than the middle point of the bearish candle from the previous day.
Know about other major Candlestick Patterns
Analysis of the Piercing Line Candlestick Chart
Before we move towards analyzing this pattern, you must keep in mind, one of the most essential rules for intraday trading.
One must avoid entering into a trade just based on one pattern. If you are a trader, you would already know the importance of risk management and capital preservation.
Therefore, whenever you see a pattern forming up on a security’s charts; make sure you have multiple confirmations before entering into a trade.
These confirmations can be factors like news etc. Another way could be developing proper strategies before using a pattern for trading.
However, you must backtest your strategy before applying it to the live market. Doing the same, will help you know about the accuracy of that strategy.
How to determine a trading pattern with Piercing Line Candlestick?
Since the piercing line candlestick pattern can indicate vital facts about taking a position in the market or in security, it is vital to track its movement.
If an investor observes a piercing line candlestick chart, then they should ideally wait to check if the high point of a candle is preceded by a bearish candle.
This is when an ideal trade setup can take place. To place a stop loss, the trader must refer to the bearish candle before the present candle.
However, it is not wise to consider making an investment decision on the basis of the piercing line candlestick formation alone.
An investor must also study security with respect to other patterns to identify an entry or exit point.
Find other important Candlestick Patterns here
How to trade using Piercing Line Candlestick Formation?
If you are a day trader, you would already know that one must avoid trading only on the basis of a pattern.
This is because the prices of a security can be affected by a variety of factors, and entering into a trade without considering other factors might lead to losses.
The patterns formed can be used to analyze a lot of things about their respective security. Though, the accuracy of your analysis can only be judged by formulating a strategy and back testing it before entering into the live market.
Initially, you might face a lot of issues while developing your strategies, but with time your analysis tends to improve, and so does your accuracy.
Before you start with formulating your strategies for trading, you must keep in mind the following points.
Doing so will help in improving your strategy that can be used for trading a piercing line pattern.
Size of the Second Candle
The size of the second candle, i.e., the bullish candle plays a very crucial role in a piercing line pattern.
As mentioned earlier, for the formation of a piercing line pattern, the second candle must close at a point that is more than half of the size of previous day’s candle.
It is not necessary for the second candle to reach the top of the previous day’s candle. The move of the candle depicts the movement in price, which tells us if the bulls were able to dominate the market or not.
A move of more than 50% represents that the bulls were not able to reverse the trend completely. However, there are very high chances of bulls taking over on a subsequent day.
Bull Divergence
While analyzing the charts, it becomes a little difficult to judge if the bulls are taking over or not.
Therefore, with the formation of a piercing line pattern, one can use various indicators that prove to be helpful.
For instance, indicators like RSI, Stochastic, and MACD can help the traders in viewing the bull divergence.
If the Bull Divergence and formation of pattern takes place simultaneously, it can be considered as a signal of a trend reversal.
Market Volume
Another essential thing to consider while trading a piercing line pattern is the market volume. By now, you would have understood the significance of the size of the bullish candle.
One must only call it a piercing line pattern if the size of the bullish candle is more than 50% of the previous candle.
This partial move represents that the bulls were not able to compensate for the total loss that happens on the previous day. However, the possibility of the prices going higher on the next day is high.
This can be judged by checking the market volume. An increase in the market volume indicates that the bulls are taking over, and the upward trend has started.
Advantages of Piercing Line Candlestick Chart
The typical characteristics of a piercing line candlestick pattern are peculiar to it. It includes both, a bullish as well as a bearish candle.
At the same time, it also indicates to the investor that a trend reversal is on the cards and the bears are losing their grip over the price.
Thus, there are considerable advantages of following and studying such piercing line candle stick. Firstly, even a beginner can identify a piercing line candlestick and so can an expert.
More importantly, the piercing line candlestick pattern opens a favorable window to risk and reward ratios.
Once the investor confirms the formation of the piercing line pattern, he can get a definitive signal that it is a good time to enter the trade.
A trader must always study additional trend patterns to be sure about a particular price movement in a security. However, there are certain limitations to the study of piercing line formation as well.
Firstly, it only signals towards a bullish reversal pattern only. It is difficult to make out any other particular trend from this pattern.
If at all an investor chooses to trade on the basis of this pattern, they will require studying additional indicators and patterns.
In spite of its potential to help an investor decide his position in the market, this pattern has one major limitation.
It still requires taking an overall look at the market and not just the piercing line candlestick pattern.
You may need to use one or more technical scanners to check the status of the market before making a final market decision.
Conclusion – Piercing Line Candlestick Pattern
The piercing line candlestick pattern is a remarkable candlestick pattern. It speaks a ton about the direction in which the price of a security is planning to move.
IT displays a remarkable occurrence when one candle is bearish while the other one is bullish.
One can easily spot a piercing line candle stick. It appears in a typical downtrend and may appear the same as a dark cloud cover.
It is in the best interest of a trader to first take a look at the appearance of the candle. And then they can trade in the security after complete consideration.
Although on its own, the pattern offers great insights into the price movement of a security, it may be insufficient to give a complete picture of the state of the market.
Open Demat Account in 10 Min & Start Trading Now!
Learn everything about Technical Analysis
| Learn Technical Analysis |
| How to Start Technical Analysis? |
| Best Intraday Indicators |
| Types of Technical Charts |
| Know about Resistance & Support |
| Dow Theory |
| Fibonacci Retracement |