Evening Star Candlestick Pattern – Meaning, Pattern, Trading Tips & more
Last Updated Date: Nov 17, 2022Often, traders describe the stock market as a battlefield. Before entering the market, you need to know that Evening Star Candlestick Pattern is no less than a battle.
Preparation is the key on the battlefield. Ideally, Japanese candlestick patterns are as unique as their names tend to be.
These patterns are mainly used to describe a large variety of patterns AKA market trends, and traders consult them frequently.
But if you are new to the market, then you need to know one thing for sure that to interpret these patterns, you need to have some excellent skills and also have an eye for details.
You might be wondering how you can learn about so many things in such a short time then be rest assured as we have got your back by covering almost all aspects from scratch about the evening star candlestick pattern.
The best part about following this guide is that we shall make you understand details in simple terms.
About the Evening Star Candlestick Pattern
The pattern is mostly used under technical analysis to identify when a trend is about to reverse.
The evening star candlestick pattern is mostly a bearish candlestick pattern that features three candles including a small-bodied candle, a large white candlestick and a red candle.
The patterns are associated with the top of price uptrend. It determines the uptrend is nearing its end.
The morning star pattern is known as the opposite of the evening star candlestick pattern, and it is viewed as the bullish indicator.
It is a reversal pattern, and it indicates the momentum of a recent trade which is slowing. The evening star candlestick pattern is most likely to be controlled by bulls which begin to lose the steam.
With minimal price movement, the star is a period balance between bulls and bears. The bears are most likely to gain control when the price momentum shifts.
The bearish top trend reversal pattern warns the traders of the potential reversal of an uptrend.
The pattern appears when the market tops and while the morning star pattern is seen when the market is at bottoms.
It strongly indicates that the downward trend in the market has begun. Though candlesticks pattern appears rarely, they are one of the most accurate indicators.
Lastly, like any other patterns, the evening star candlestick pattern should also be used in conjunction with other indicators.
Open Demat Account in 10 Min & Start Trading Now!
The working of Evening Star Candlestick Formation
The evening star candlestick pattern is most likely to depict some information about the security.
Generally, it shows the high, low, opening and closing price for given security for a particular timeframe.
Each candlestick features two wicks and a candle. The candle’s length is a function of the range between the maximum and minimum price of the stock during a trading day.
A considerable change is the price is depicted by a long candle while a small change in price is indicated by a short candle.
In simple words, we mean to say that the long candlestick bodies show massive buying or selling pressure based on the direction of the trend.
On the other hand, little price movement is characterized by short candlesticks.
Know about other major Candlestick Patterns
Formation of the Evening Star Candlestick Chart
The evening star candlestick is known to be a pretty strong indicator of future price falls. The pattern is most likely to be formed over a period of three days.
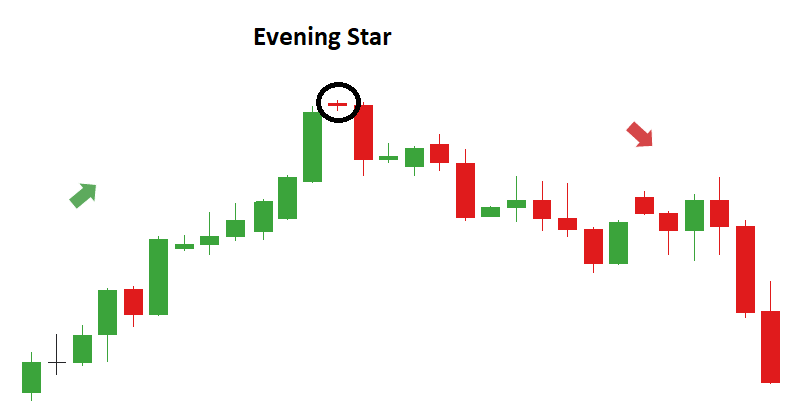
Under the first day formation, we see the large white candle, which indicates a continuous rise in price.
In contrast, on the second day, we see a smaller candle which shows a modest price increase and lastly on the third day we see a large red candle that opens lower than the price of the previous day and then ends at the middle of the first day.
It is said that the evening star indicator is a reliable indicator which shows that a downward trend has begun. Furthermore, it can be challenging to discern amidst the noise of stock price data.
Often traders use price oscillators and trendlines to not only help in identifying the reliability but also to confirm whether the evening star candlestick has appeared or not.
Despite being a popular bearish indicator, traders tend to use other indicators also to understand the trend in the market. Different traders use different indicators based on their choices.
Tips to Trade using the Evening Star Candlestick Pattern
Choose the right chart timeframe – When it comes to choosing the right time frame, a plethora of factors tend to play a crucial role, and it mainly depends on the trading strategy you choose.
It would be best if you changed your strategy with time, but above all, you need to practice your thesis with paper trading.
Learn about the open, close, high and low prices – When you look at a chart, then you are most likely looking at the open and close prices.
You need to get familiar with the prices to understand the price action on the candlestick chart.
Wait for the routine RSI to hit more than 70 – Majority of the traders consider that when the RSI crosses above 70, then it is a clear overbought indicator.
Reduce the timeframe – It is time to zoom in once you identify the overbought condition that is RSI above 70 on the long term chart.
One of the most common timeframes for this is using the five-minute candlestick chart. Almost all traders like it because it is neither too fast nor too slow.
Short selling – When you borrow and sell shares of a stock, it is termed as short selling. You might expect the price to drop when you borrow at a high price.
However, this strategy is not recommended for new traders in the market.
Find other important Candlestick Patterns here
Conclusion: Evening Star Candlestick Pattern
The Evening Star Candlestick Pattern is most likely to provide a trader with a signal for the entry and exit point.
Even though the pattern is seen rarely, but it is a reliable technical indicator to predict the future price decline.
Open Demat Account in 10 Min & Start Trading Now!
Learn everything about Technical Analysis
| Learn Technical Analysis |
| How to Start Technical Analysis? |
| Best Intraday Indicators |
| Types of Technical Charts |
| Know about Resistance & Support |
| Dow Theory |
| Fibonacci Retracement |