Bullish Belt Hold Candlestick Pattern – Basics, Meaning, Requirements, Trading & more
Last Updated Date: Nov 16, 2022There are arrays of candlestick patterns that traders use for trading, but under this guide, we shall mainly focus on the Bullish Belt Hold Candlestick Pattern.
Stock trading is one of the most complicated businesses that features in-depth knowledge of various parameters and essential practices.
Almost all investors take into count some factors before investing that includes investment goals, horizons, and risk-taking capability.
Thus expert traders deep dive into a plethora of charts and analytical indicators like candlestick patterns.
Ideally, candlestick patterns are technical tools that tend to create a pattern that helps in determining the direction of the price of the securities.
About Bullish Belt Hold Candlestick Pattern
Ideally, a bullish belt bold candlestick pattern is a type of Japanese candlestick pattern which mainly tells a possible reversal of the upcoming downtrend.
It is a bullish reversal candlestick pattern that you can see near the end of a downtrend, and it mainly indicates a reverse in the investor sentiment.
You can quickly identify this type of candlestick pattern because it tends to lack the lower shadow.
When a bullish belt holds candlestick pattern appears in the market, one can know that the buyers have had dominated the security price during the entire trading session as you can see that the security’s price doesn’t fall down more than its opening price.
As the trading session opens, the security price has moved more high, and that is the only reason why the lower shadow doesn’t exist for the bullish belt hold candlestick pattern—all it means that the buyers have been controlling the market throughout the trading season.
You can also say that the bullish belt hold candlestick pattern is not the most reliable of all the candlestick patterns.
Still, it can be reliable when you combine it with other bullish reversal candlestick pattern, including the piercing candlestick pattern, then there is likelihood that the downtrend is more and the uptrend will continue to increase.
Bullish Belt Hold Candlestick Pattern in Japanese
The candlestick pattern is also known as Yorikiri in Japanese.
In simple terms, you can say that the bullish candlestick pattern is a single bar candlestick pattern that suggests a potential reversal of the prevailing downtrend in the market.
Under this candlestick pattern, a trading day is most likely to open at the lowest level, but with the progression of the trading day.
The price of the security will shoot up and will lastly close near a high. But, it is also said that the trading would not always close at its peak point.
Open Demat Account in 10 Min & Start Trading Now!
How does a Bullish Belt Hold Candlestick looks like?
Experts suggest that the bullish belt hold candlestick pattern appears similar to white Marubozu, which is most likely to open at the low of the period, and it subsequently rallies to close near its peak, which tends to leave a shadow at the candle’s top.
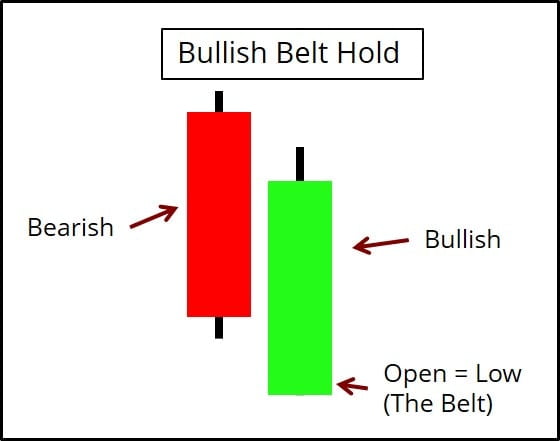 After a stretch of bearish candles in the downtrend, the pattern is most likely to surface. Additionally, the candle’s opening price is most likely to be less than the previous day’s low.
The pattern closes perfectly into the body of the last candle, which holds price from falling further, and hence it is termed as bullish belt hold candlestick pattern.
The candlestick pattern often indicates a shift in sentiment of the investor from bearish to bullish.
It also occurs frequently by which it means that the mixed results form the base in predicting the future price of the security.
If it forms near the support level like the trend line or moving average, the potency of the candlestick is most likely to be increased.
Besides any other candlestick chart pattern, traders must consider at least two days or more of trading when predicting market trends.
The bullish belt is most likely to be found across almost all time frames. Lastly, the pattern is said to be most reliable when used on daily and weekly charts.
Know about other major Candlestick Patterns
Requirements for Bullish Belt Hold Candlestick Chart
Here are the basic requirements –
- The pattern can be either a complete bullish reversal candlestick pattern, or it can also be a part of a bullish candlestick pattern in continuation.
- Pattern also features a shaven bottom, by which we mean that it has no lower shadow or the lower shadow is relatively minimal.
- The price of the security must close at or near the peak of the highs during the trading session.
- The pattern must feature almost all green-colored bodies, but in some cases, it can have a red body also.
How to trade using Bullish Belt Hold Candlestick Pattern?
Just like many other candlestick patterns, avoid using the bullish belt hold candlestick pattern in isolation.
While trading in the market, you can use the bullish belt hold pattern along with other technical indicators and price patterns as they can drastically increase the probability of a valid signal.
For instance, if the bullish belt hold candlestick pattern might open lower than previous swing low and close more than the point to form a potential double bottom.
The bullish belt hold must be seen in long white or green candlestick to indicate that the bulls have taken control.
The candle before the pattern must be accompanied by the above-average volume to signal the climatic selling pattern and a potential reversal upside down.
On some occasions, the bullish belt hold candlestick is most likely to be a pause in the intermediate downtrend, and the traders prudently wait for the price in order to confirm the pattern.
Traders could place a stop-loss order at its midpoint if the bullish belt hold candlestick pattern is long. Though it needs a complete stop, the chances of market noise interfering are minimum.
Find other important Candlestick Patterns here
Conclusion – Bullish Belt Hold Candlestick Pattern
After you understand the basics of the bullish belt hold candlestick pattern, you can start trading.
But as a trader, you must consider at least two days or more of trades while predicting trends. Also, traders play a crucial role in its formation.
Open Demat Account in 10 Min & Start Trading Now!
Learn everything about Technical Analysis
| Learn Technical Analysis |
| How to Start Technical Analysis? |
| Best Intraday Indicators |
| Types of Technical Charts |
| Know about Resistance & Support |
| Dow Theory |
| Fibonacci Retracement |