Learn about Single Candlestick Pattern – Marubozu, Dojis & more
Last Updated Date: Nov 17, 2022This Article educate readers regarding the Single Candlestick Pattern. This is an important aspect in technical analysis which is used by almost all analyst.
We have effectively covered all the aspects of the pattern, to help traders engage in successful trades.
About Single Candlestick Pattern
 Only one candle forms the Single Candlestick Pattern which means that only trading action of one day is used to generate the trading signal.
The length of the candle is to be considered to qualify the trades. It is very important to learn and understand the candle to become successful at stock trading.
These candles describe the movements of the stock, derivative, or currency. The patterns help to decide the entry as well as exit points of the trade.
If the patterns are identified and executed correctly, then the Single Candlestick pattern can be very profitable.
Open a Demat Account Now! – Start Trading
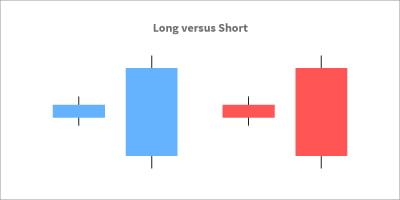
The Marubozu – Single Candlestick Pattern
In Marubozu, the last candle has more importance while prior trends do not have much importance.
Even though the trading implications remain the same, it can still appear in the chart anywhere irrespective of the preceding trend.
Bullish Marubozu Candlestick Pattern
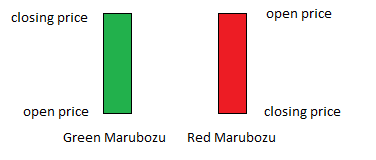
In Bullish Marubozu, the upper and lower shadow is absent. This implies that the open price is equal to the low price and the close price is equal to the high price.
Basically, it contains a body with no shadows. In this case, the candle opens at its lowest price and closed at its highest price.
In the entire session of Bullish Marubozu, the buyers were in control. Consider an example, there are two types of traders. One trader is a risk-taker and the other is risk-averse.
When the marubozu forms, the risk-taker trader would buy the stock on the same day. On the other hand, the risk-averse trader would buy the stock on the next day.
The condition for the formation of marubozu can be identified when the current price of the market is approximately equal to the high price of the day.
In addition to this, the opening price of the day is approximately equal to the low price of the day. There is more likely continuation when the Bullish Marubozu forms at the end of the downtrend.
There is more likely reversal when the Bullish Marubozu forms at the end of the uptrend.
Learn everything about Technical Analysis & make for money in stock market
Stop Loss on Bullish Marubozu
There are chances that after buying the stock, the direction of the market reverses.
When such a situation arises and trade goes wrong then stop loss on Bullish Marubozu comes into the picture. If the price reaches the low of the marubozu, then the trader should exit the stock.
In such times, it is better to book loss as the stock continues to go down.
There are many possibilities, one such possibility is that the market goes in the opposite direction and the trader exits the stock, but then the market again reverses the direction and the stock goes up again.
Even though there are such possibilities, it is still better to exit the stock and stick to the rules.
Bearish Marubozu
In Bearish Marubozu, the open price is equal to the high price and the close price is equal to the low price.
This implies that the candle opens at its highest price and it closes at its lowest price. In the entire session of Bearish Marubozu, the sellers control the price action.
There is more likely continuation when the Bearish Marubozu forms at the end of the uptrend.
There is a more likely reversal when the Bearish Marubozu forms at the end of the downtrend. In this case, the selling pressure is high.
The traders expect more negativity in the price of the share so they are willing to sell the shares at the lows of the day.
This type of trade is not for scalping purposes instead we hold it until it reaches the desired price in trade.
The best strategy for this type of trade is trailing stop losses as it leads to winning trades.
Trade Trap Candlestick Pattern
The traders should avoid trading when the candle is extremely small and when the candle is extremely long.
The extremely short candles include below the range of 1 percent and the extremely short candles include above the range of 10 percent.
With the extremely short candle, it is difficult to identify the direction of the trade and with the extremely short candle, it is difficult for the placement of stop loss.
Spinning Top Candlestick Pattern
The pattern of the Spinning Top indicates the indecision between the buyers and sellers. It has a long upper as well as a long lower shadow.
It has real bodies that are smaller in size. This pattern is incorporated in trading as it can be easily identified with minimal time investment.
During the formation of the Spinning Top, the traders may shift prices both higher as well as lower within the chart period while the candle was forming.
You can see a substantial movement in price at the time of the candle period since the Top displays a wider candle.
The result of this pattern is a standoff since both the buyers and sellers could not gain the upper hand. The traders use the information in this pattern to position themselves in the market.
Consider an example, the open price is 205 INR and the close price could be 208 INR.
The traders can get the most out of the Spinning Top when they are seen with respect to the trends in the market.
Downtrend Spinning Tops Candlestick Pattern
In the downtrend, the bears try to bring the prices lower as they are in full control. While the bull tries to position themselves but are unsuccessful.
Two types of conditions can occur, either reversal or continuation. If the Spinning Top pattern falls at the time of downtrend, then it indicates that there are not many sellers left. It means that possible reversal in direction could occur.
There is an equal probability of another round of selling and reverse of market direction where it would lead to an increase in price.
At the time of Downtrend Spinning Tops, the traders can invest half the quantity so that they get an idea of the market.
After investing, if the price goes down, then the trader can exit the stock and book a loss. The traders would suffer only half the loss which is better than a total loss. In the other scenario, if the price goes up, then the traders can invest the other half quantity and get profits.
Uptrend Spinning Tops Candlestick Pattern
When the Spinning Top pattern is in an uptrend then it means that the bull has been in control over the previous few trading sessions.
But since there is a formation of the Spinning Top, it indicates that bulls no longer have absolute control. This means that the bears have entered the market though not successfully but they still got the freedom to move.
If the Spinning Top pattern falls at the time of uptrend, then it indicates that there are not many buyers left. It means that possible reversal in direction could occur.
At the time of Uptrend Spinning Tops, the traders can book profits on half the quantity so that they get an idea of the market.
After investing, if the bear makes an entry and the price goes down, then the trader has already booked a higher profit on the 50 percent and they can book the profit on the other 50 percent.
Even though the profit booked on the remaining 50 percent would be less compared to the previous, it would still be higher than the current price of the market.
In the other scenario, if the bull enters the market and the price goes up, then the traders would have the remaining half quantity that will give them higher profits.
Dojis – Single Candlestick Pattern
The open and close prices in Doji are the same. This indicates a struggle for turf position between the buyers and the sellers.
Basically, the result of the struggle is essentially a draw where neither the buyers nor the sellers were able to gain control.
There are different types in Doji, they are long-legged, dragonfly, gravestone, and four prices. The long-legged Doji signifies that the prices are closed higher than the low of the trading day.
The Dragonfly Doji signifies the reversal of the current trend. The gravestone Dogi also signifies the reversal of the current trend. The four price Doji signifies a lack of volatility.
This also indicates that in the trade that took place on this day, the selling and buying prices were the same.
Using Dojis, the traders can get the idea of the direction of the stock price.
Paper Umbrella – Single Candlestick Pattern
The position of the paper umbrella on the chart affects interpretation. It is characterized by a small upper body followed by a long lower shadow.
The concept of paper umbrella mainly comprises two trend reversal patterns, which are the hanging man and hammer which respectively suggest bearish and bullish patterns.
If the paper umbrella is positioned at the crown of an uptrend rally, it becomes a hanging man. On the other hand, if it comes at the bottom of a downward trend, it would be a hammer.
In order for a candle to be a paper umbrella, the lower shadow should have a length twice that of the real body. This is what we refer to as the shadow to real body ratio.
Hammer Formation Candlestick Pattern
Hammers can occur in any color. At the same time, we should ensure that the hammer qualifies ‘the shadow to real body’s ratio.
It should be mandatory that the prior trend of the hammer is a downtrend. This becomes clear with the curved line. We can further explain it as the following.
When bears stay in absolute control of the market, there is a downward trend. In the course of a downtrend, the market is likely to open lower than the previous day’s close.
This will further close forming a new low. When the hammer pattern is formed, there will be a downtrend in the expected trades which form a new low.
At the same time, at the low point, a rise of a certain amount of buying interest drives the prices higher such that the stocks close near to the high point of the day.
The price action of the day which formed the hammer would signify the successful action of bulls to break the prices from falling any further.
This action can be considered to have the potential for changing the sentiment of the stock. This gives the suggestion for buying opportunities.
Thus, the trade has formed a change giving a prospective intraday profit. It is to be mentioned that once a trade is initiated, the trader has to stay with it until he either reaches the stop loss of the target.
The loss cannot be ignored in certain hammer trades but can be considered to be a calculated risk rather than a speculative risk.
Hanging Man Candlestick Pattern
The bearish Hanging Man can be characterized by a paper umbrella in trend. It is a candlestick and a top reversal game that signals the crown of a market.
We can only qualify as a hanging man if it had an uptrend prior to it. Due to this, it signifies selling pressure.
It can come in any color as long as it follows the ‘the shadow to real body’ ratio. The market is following an uptrend with the bulls in control.
On the day of hanging man formation, the bears would have made their presence which is seen by the long lower shadow of the man.
The entrance of bears shows the strongness of the bulls breaking by them.
An example can help illustrate this. BPCL Ltd has a hanging man at 593 with the OHCL details as: Open = 592, High = 593.75, Low = 587, Close = 593.
Based on this, the risk-taker would start the short day on the day of hanging man formation (593). The risk-averse would start the short trade in the following day at closing prices by confirming that it is a red candle day.
The risk-taker and the risk-averse would start their respective trades. For this particular trade, the stop-loss price would be more than the high price.
This would give profits to both the risk type.
The Shooting Star Candlestick Pattern
This is a much powerful candlestick pattern for the price action. It is structured in the form of an inverted paper umbrella. The trend should be bullish before formation.
This can be explained as follows.
The trade would be in an uptrend showing the bulk in total control. On the day of the formation of the shooting star, the marker trades higher forming a new high.
However, the high point of the day contains a selling pressure until the stick price reaches a low point of the day. This forms a shooting star.
The selling will indicate the entry of the bears which can be seen in the long upper shadow. When there is a trigger in the stop loss, the trader would find the need to exit the trade.
This would be the best option in that situation.
Single Candlestick Pattern – Conclusion
Single candlestick pattern, if identified and executed proper will lead a pathway of profitable trade. Regarding the he hanging man and hammer, they both give a valid candlestick pattern.
If there were equal opportunities, we would choose to place our money on hammer from our experience with both options.
Open a Demat Account Now! – Start Trading
Most Read Articles