Three Black Crows Candlestick Pattern – Meaning, Formation, Interpretation, Limitations & more
Last Updated Date: Nov 17, 2022Find all details about Three Black Crows Candlestick Pattern here.
Almost all of us are aware of the fact that crows are omens, foreshadowing awful news on the horizon mainly.
However, it is different in the world of Japanese candlesticks, as under the candlesticks theory, the black crows’ candlestick pattern tends to take the shape of three descending candlesticks which tend to form a stairway.
Be it real life or the stock market there is no joy to see the black crows anywhere. All you need to do is flip your wings and soar down if you want to learn more about the three black crows candlestick pattern.
We have covered everything, including the basics in this guide.
About Three Black Crows Candlestick Pattern
The three black Crows candlestick pattern is mainly used in the technical analysis of the stocks, indices, currencies etc.
It is used to detect the reversal with regards to the uptrend. It happens when the bearish forces are more as compared to bullish details on three consecutive days.
Once you identify the bearish pattern in the technical charts, then you can grab the opportunity to take a short position that might arise to gain the benefit of the reversal trend that follows the uptrend.
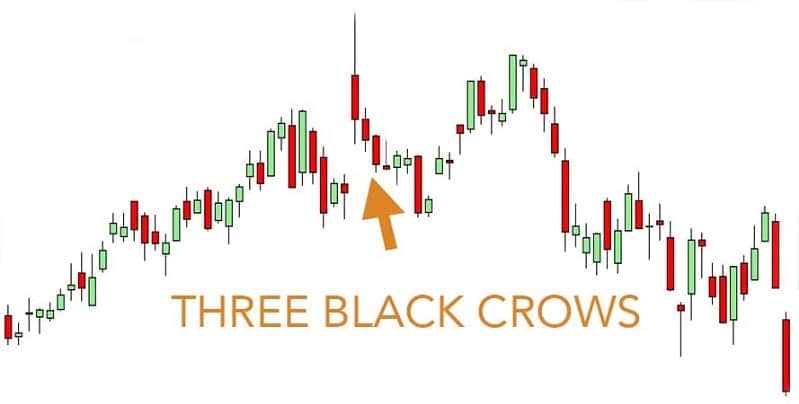
In simple terms, the Three Black Crows candlestick pattern depicts a bearish candlestick pattern that assumes the reversal of an uptrend. These candlestick charts are known to show the high, low, opening and closing on a specific stock.
The candlestick is either white or green for stocks moving higher. On the other hand, the candlesticks turn to be red or black when they move lower.
Ideally, the Three Black Crows candlestick pattern features three consecutive long bodies that have opened amid the real body of the last candle and have closed lower than the previous candle.
Traders often tend to use this indicator with other indicators as confirmation of the reversal.
These candlesticks are seen at the end of the bullish trend, which means that there is a shift of control to the bears from the bulls.
Open Demat Account in 10 Min & Start Trading Now!
What does Three Black Crows Candlestick Formation Signify?
It means that after a period of power, the strength of the bulls tends to be decreased, and the bears are in control to push the price downwards now.
They march down for three successive days and then create a strong price reversal. The vigour of the bears is mainly identified with the continuous downward movement.
The price is pushed downwards primarily due to the adverse market sentiments, and it is primarily showing a strong reversal that is shifting from a bull market to bear market.
It confirms mostly that the upward price movement has ended. The trend seems to be most useful for long term traders.
If you have spotted the Three Black Crows candlestick pattern, then you can understand it in a better way by keeping a tab on the length of the candle.
You should know that the second and third candle should be of the same length and the size.
If at all you see, the third candle is smaller as compared to the other two, then it indicates weakness, and it can be concluded the pattern is not too reliable.
Know about other major Candlestick Patterns
Explanation of Three Black Crows Pattern
This type of pattern is a visual pattern, and by that, we mean there are no specific calculations to stress about when identifying this indicator.
This pattern mainly occurs when bears tend to overtake the bulls during three consecutive trading days. The pattern features three long-bodied candlesticks with no wicks or short shadows.
Typically, under the three black Crows candlestick pattern, the bulls are most likely to start the session with price opening modestly higher as compared to the previous closing price.
Still, the price is most probably pushed lower during the entire session. But in the end, you might see the price closing near the session’s low under pressure from the bears in the market.
Additionally, the trading action results in short or almost all no shadows. Often these traders depict the downward pressure over the prevailing sessions, to begin with, a bearish downtrend.
How to interpret the Three Black Crows Candlestick Chart?
Under the three Black Crows candlestick pattern, each candle tends to close lower as compared to the previous one.
It marks an aggressive move by the bears in the market to bring back the price back and also reverse the earlier gains by the bulls.
Additionally, each candle features a short lower shadow or no shadow at all as it signals bears are successful in keeping the price down in each trading session.
The strength of the bearish force is confirmed when all three candles featuring large bodies of the average same size are seen.
Find other important Candlestick Patterns here
When do the Three Black Crows Candlestick appear?
Mostly, the Bearish Crow Candlestick pattern appears at the end of the bullish trend.
It is mainly considered as the sign of the upcoming bearish signal, and it is not a very strong indicator as the pattern appears after the strong trend.
However, it is quite possible that the patterns are too aggressive as the candles are excessively large, so it is indicated that bears have overstretched themselves, which pushes the security in the oversold category.
Under this situation, the bears should be aware that the reversal doesn’t become the retracement as it is quite possible that bulls will take advantage of the decreasing momentum.
Limitations of using Three Black Crows Candlestick Pattern
Traders should be aware of the oversold conditions that could mainly lead to consolidation before they move further lower, provided the Three Black crows Candlestick pattern involves a significant lower move.
The trading strategy can be successful only when the pattern is used along with other indicators.
Conclusion: Three Black Crows Candlestick Pattern
The indicator is a trend reversal pattern which is formed to show the downtrend in the security’s price after the symbolic move has been seen in the price.
Three standard bearish candlesticks form this pattern. Profit will take place along the pattern only after the signs of trend reversal are seen.
Open Demat Account in 10 Min & Start Trading Now!
Learn everything about Technical Analysis
| Learn Technical Analysis |
| How to Start Technical Analysis? |
| Best Intraday Indicators |
| Types of Technical Charts |
| Know about Resistance & Support |
| Dow Theory |
| Fibonacci Retracement |