Candelstick Patterns, Charts : Types of candlestick, Analyisis
Last Updated Date: Nov 16, 2022Candlestick Patterns or Charts is one of the most important part of Technical Analysis. In this article, you will learn about Candlestick lines, its importance, types & more.
Lets get started & understand everything about Candlestick Charts.
About Candlestick Patterns & Charts
Developed in the 18th century by a rice trader, this trading technique generates signals according to the relationship between open, high, low, and close prices.
It includes an insightful blend of candlesticks with traditional technical tools using candles, chart patterns, and indicators.
As a very first step, traders have to choose a candlestick as their chart type and then carry forward its implementation.
Both of these things are very different from each other. The implementation, however, needs to be price effective to take advantage of the candlestick patterns.
This technical technique helps the traders to gauge the strength of price moves and recognize reversal patterns by providing an analysis with the aid of western techniques.
Upon recognizing the number of patterns with their unusual names, they can take complete advantage of the candlestick pattern if the implementation is the most price-effective.
It is equally important for traders to understand the western technical analysis as, it is possible that due to low interpretation, they can fail to use candlesticks in a proper context.
Alongside the western aid, understanding the emotional crowd and lines and patterns is essential as it makes the candlesticks valuable.
Open Demat Account in 10 Min & Start Trading Now!
Importance of Candlestick Charts & Patterns
According to an author, the candlestick charts are more effective than bar charts. They both, if compared, provide the same price data but, candlestick lines provide an outlook of the investing crowd.
These insights, in the candlestick chart, are visible as highlighted and hugely differ from bar charts. As both of these charts use similar price data, the technology tools used in the bar chart can be applicable in candlesticks.
They are a quicker and efficient way to recognize the bar that can be either bearish or bullish, that is, black or white, respectively.
As discussed above, due to the insights provided by candlesticks, the boxes in the chart require more space making it difficult to read the details after tightly compressing.
But, by using modern charting techniques, it is possible to zoom in and out according to necessity.
So, by using these charts data, traders basically rely on history and make assumptions regarding future sessions according to the observations from past and available factors.
Learn everything about Technical Analysis & make for money in stock market
Types of Candlestick Patterns
There are numerous patterns that candlesticks use, but it doesn’t necessarily apply all of them. So traders need not worry about learning each pattern.
These patterns help recognize the analyzing charts and familiarize them with traders to understand if they no longer need it.
Several patterns include high-profit candlestick patterns and reversal patterns along with others that have unusual yet interesting names.
These patterns do not provide price targets, instead provide projecting targets, and, on the other hand, reversal patterns do not estimate the duration of a price move.
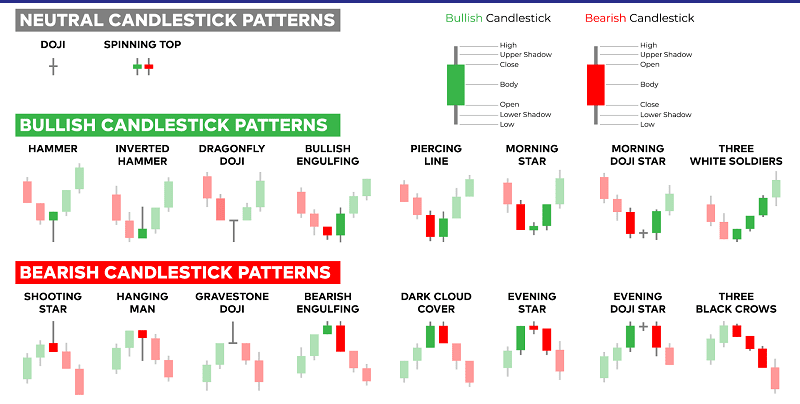
Typically, candlesticks are categorized as single candlestick patterns and multiple candlesticks patterns.
Single Candlestick Patterns
Under the single candlesticks pattern, there are marubozu, meaning, close-cropped that are further classified as bullish marubozu and bearish marubozu. Traders generally call these candle lines as flat tops or flat bottoms.
A Doji is also a single candlesticks pattern that consists of a unique single line. There is also a gravestone Doji that is just a variation of Doji with no additional continuation pattern.
In a bearish pattern, Doji is in the north whereas in a bullish pattern, Doji is in the southern reversal.
Spinning tops are candlesticks with a small real body that can be either black or white. This pattern means that the real body of this candle line should be smaller in comparison to its shadows.
It is also a component of several reversal patterns and it is also referred to as a short candle.
The umbrella concept relies on the look of umbrella lines as a hanging man and hammer. Both patterns have the same shape and come under the reversal patterns.
The only difference between them is the price criteria that either advances and cause it to be a bearish hanging man, or declines making it a bullish hammer.
The shooting star is a bearish type of reversal candlestick pattern with its upper shadow to be only one and a half times the length of the real body.
It has no lower shadow with the price closing near the low range. It has insignificant small body color that varies to be black or white.
Multiple Candlestick Patterns
These include the patterns that have a combination of multiple candles. These have multiple signals where one reversal pattern is back to back another.
Engulfing Pattern
There are two types of engulfing pattern, bearish engulfing and bullish engulfing. The pattern that engulfs the prior entire body of the candle without causing a dark cloud cover pattern is a bearish engulfing pattern.
If a pattern engulfs the prior candle’s entire real body and it is not a piercing pattern, then it is a bullish engulfing pattern.
Harami Pattern
Harami is also an important component of candlesticks that falls under a pattern. It can have a bearish or bullish form depending on price variations.
If the price advances, it is a bearish harami pattern, and if the price declines, it is a bullish harami pattern.
In the harami pattern, the first candle has a long real body, and its color represents the trend. In a downtrend, the color is black whereas, in an uptrend, the color is white.
The second candle has a comparatively shorter real body and mostly it will be a spinning top. The color of the second candle is generally opposite of the prior real body.
Piercing Pattern
The piercing pattern is a bullish reversal pattern that is formed from two candlesticks of the opposite color just like dark cloud cover.
It forms after a price decline and is strong in nature. The first candle has a bearish real body whereas the second candle has a bullish real body.
The dark cloud cover, in the same manner, has its first candle with a strong bullish real body whereas the second candle has a bearish real body.
Morning star is a three candle pattern that forms after a price decline. The Evening star is a bearish triple candlestick pattern that comes into place after a price advance.
Understanding Candlestick Patterns & Charts
Here are few important things to know before you start analyzing Candlestick Charts & Patterns.
Ability to Signal Turning Points
It analyzes the charts and accordingly buys strength alongside selling weakness. The bullish candle represents strength and the bearish candle represents weakness.
These are easily recognizable by the color associated with them that makes buying and selling more convenient. The bullish candle is blue whereas the bearish candle is red.
Identifies the nature of the trend and accordingly acts
It quantifies and verifies the market conditions but it is the responsibility of the trader to maintain an eye on even the minor variations.
They must be flexible within limits to achieve stability in the charts.
Ensure the history of the trend
If a trader is looking forward to implementing a bullish pattern, the prior trend must be bearish and vice-versa.
As the first subtopic focuses on the same, the idea is pretty clear on the importance of this assumption.
Conclusion – Candlestick Patterns
The factors that play a major role in the implementation of candlesticks begin with the reason and necessity of the purpose behind it.
- The differentiation between the steps of first choosing a chart type and later implementing it on the trend.
- The bifurcation of candlestick patterns into single and multiple candlestick patterns.
- Different types of single candlestick patterns include marubozu, Doji, spinning tops, umbrella, and shooting star.
- The different types of multiple candlestick patterns include the engulfing pattern, harami, piercing pattern, dark cloud cover, the morning star, and the evening star.
- The assumptions regarding the candlesticks.
Open Demat Account in 10 Min & Start Trading Now!
Most Read Articles