Spinning Top Candlestick Pattern – Meaning, Formation, Trading, Limitations & more
Last Updated Date: Nov 17, 2022One of the essential parts of the Vast Japanese candlestick pattern repertoire with its own unique characteristics is the Spinning Top Candlestick Pattern.
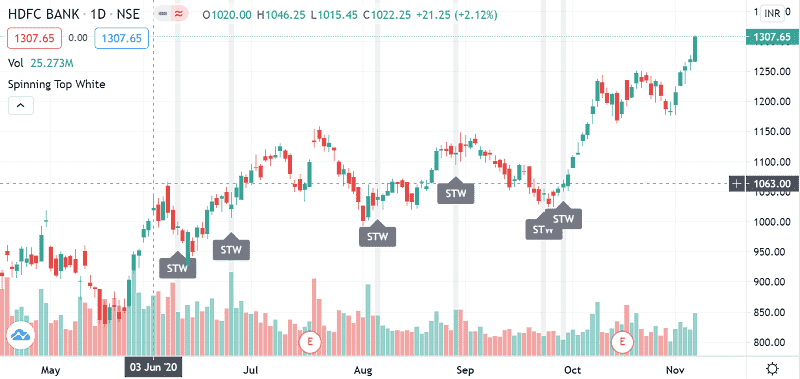
These candlesticks are most likely to be associated with the general indecision in the market. Spinning top candles can indeed offer valuable information that supports the trading strategy.
If you are someone who doesn’t know much about this pattern, then you don’t need to stress as we have covered pretty much everything in this guide, and it is suitable even for beginners.
But before learning more about the pattern, you need to know one thing for sure, that unlike other candlestick patterns, this pattern doesn’t indicate any trading signal which can help traders to enter or exit the market.
About Spinning Top Candlestick Pattern
A spinning candlestick pattern is most likely to feature a real short body which is vertically placed between long upper and lower shadows.
Ideally, the candlestick is said to represent the indecision about the future direction of the security. Neither the sellers nor buyers can avail of the upper hand gains.
During the period, the buyers tend to push the price up while, on the other hand, the seller force and push the price down, but irrespective of anything, the closing price is most likely to end quite close to the opening price.
Spinning top mainly signals a future reversal in price after a substantial price advance or decline, provided the candles that follow confirms.
A spinning top is most likely to have a close above or below the open but only at one condition that the two prices need to be close together.
In simple terms, the spinning top candlestick chart pattern is a formation that appears when both sellers and buyers balance each other out.
It also results in a similar opening and closing price. It is mainly due to minor changes in the market condition, and the candlestick is also known as the continuation pattern.
In this chart pattern, there are two variations that are the bullish spinning top, which can be seen in green color, while the bearish spinning top can be seen in red color.
When the closing price is more than the opening price, the bullish formation occurs, while on the other hand, when the opening price is more than the closing price, the bearish formation occurs.
Open Demat Account in 10 Min & Start Trading Now!
Features of Spinning Top Candlestick Formation
Just like all other candlestick patterns, the spinning top features a wick and body:
- The wick is known to be formed by the vertical line, and the horizontal lines form the body.
- The length is most likely to vary as the top depicts the highest price, and the bottom shows the lowest price.
- The body is also likely to vary in height as it shows the difference between closing and opening price.
Thus, the candlestick involves a single candle, which signals uncertainty in the market. The candlestick pattern is said to be defined by a short body encircled by long wicks on either side.
It is said that the spinning top candlestick pattern can be either bullish or bearish when the candle closes.
The location of the candlestick can be anywhere from uptrend, downtrend, or consolidation, which mainly signifies reversals possibly.
Know about other major Candlestick Patterns
How does Spinning Top Candlestick Chart looks like?
It is said that, in the spinning top candlestick pattern when the bulls push the price, which is more than the opening price, and then bears tend to force it back down prior to the market closes.
When the bearish traders move, the prices lower as compared to the open price, and bullish traders move it back up prior to market closes.
In simple words, the market seems to explore upward or downward options but then settles at more or less the same opening price, which is most likely to result in no meaningful change.
It is a simple logic behind the indecision shown in the market as when the candle was formed; traders tend to move both the prices higher and lower during the chart period.
It results in the closing price reverting back to the opening price. The spinning top pattern is most likely to follow a similar pattern and logic like Doji candlestick.
How to trade using Spinning Top Candlestick Pattern?
There are some ways to trade when you see the spinning top candlestick pattern. One of the most important steps is to confirm the signal.
The majority of the traders tend to use technical indicators to ensure what they believe a spinning top indicates. These technical indicators can offer significant insight into the price of the security.
Find other important Candlestick Patterns here
What does Spinning Top Pattern tells you?
Spinning tops are most likely to indicate the indecision of the security as the upper and lower shadows. This didn’t result in any meaningful change in the price between the opening and closing price.
The bulls send the price too high, and bears send the price extremely low, but in the last, the price seems to close nearby open.
This indecision can indicate more sideways movement, especially if the spinning candlestick pattern chart appears within an established range.
It can also mean a possible price reversal if at all, it occurs after a price advance or decline. Sometimes spinning top candlestick pattern indicates a significant trend change.
The bulls are losing control if the spinning top pattern occurs at the uptrend. Thus, when you see a spinning top candlestick pattern, then bears are losing control.
Limitations of Spinning Top Candlestick
Spinning top candlestick patterns is expected, which means most of the patterns witnessed will be inconsequential as securities have periods of assets as it makes sense.
Spinning tops frequently occur when the price is moving sideways or is about to begin. The reward potential is also challenging as the pattern doesn’t offer a price target or exit plan.
Conclusion – Spinning Top Candlestick Pattern
The spinning top candlestick pattern mainly shows the indecision among the buyers and sellers that could show price reversals.
It is essential to recognize the location of the spinning top amid the market.
Open Demat Account in 10 Min & Start Trading Now!
Learn everything about Technical Analysis
| Learn Technical Analysis |
| How to Start Technical Analysis? |
| Best Intraday Indicators |
| Types of Technical Charts |
| Know about Resistance & Support |
| Dow Theory |
| Fibonacci Retracement |