Piercing Line Candlestick Pattern – Meaning, Analysis, Formation, Advantages & more
Last Updated Date: Nov 17, 2022The Piercing Line Candlestick Pattern is one of the most commonly seen patterns while analyzing charts.
The pattern is formed on a two-day scale and represents high chances of a short-term bullish reversal.
In simple words, the pattern is included at the end of a bearish trend from where the prices tend to hike, signaling a bull move.
About Piercing Line Candlestick Pattern
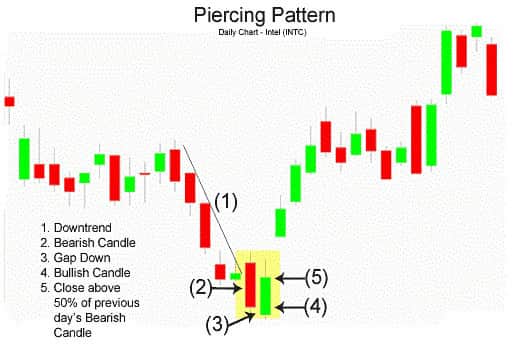
The pattern is formed using two candles, which must fulfill the following conditions:
In this case, the first candle is a bearish candle that is formed during a downwards trend. The candle generally opens near the day high and closes near the low with a large body.
The second candle plays a crucial role in this pattern. It opens with a gap down, i.e., the opening price is lesser than the previous day’s close.
However, the price tends to go upwards, and the candle closes at a point that is more than half of the last day’s candle.
If you observe a pattern that fulfills the conditions mentioned above, it must be a piercing line pattern. Let us now try to analyze the pattern and its significance.
Open Demat Account in 10 Min & Start Trading Now!
Analysis of the Piercing Line Candlestick Chart
Before we move towards analyzing this pattern, you must keep in mind, one of the most essential rules for intraday trading.
One must avoid entering into a trade just based on one pattern. If you are a trader, you would already know the importance of risk management and capital preservation.
Therefore, whenever you see a pattern forming up on a security’s charts; make sure you have multiple confirmations before entering into a trade.
These confirmations can be factors like news etc. Another way could be developing proper strategies before using a pattern for trading.
However, you must backtest your strategy before applying it to the live market. Doing the same, will help you know about the accuracy of that strategy.
Know about other major Candlestick Patterns
Formation of Piercing line candlestick pattern
As mentioned earlier, the piercing line pattern is a two-day pattern formed by analyzing the chart for two consecutive days with two candlesticks.
 Since, the first candle is bearish and the second one is bullish, one can say that the first one is dominated by sellers while the other one by buyers.
The first candle that forms during the downward trend opens near its high and closes near the day’s low. The body of this candle can be average-sized. What’s more important is the second candle that is formed.
The second candle opens with a gap down, which plays a crucial role in forming this pattern. The gap’s size tells the trader about the chances and strength of reversal that will occur.
Since the next candle opens with a gap down, it is evident that the second candle opens at a price lower than the previous close.
However, even after opening with a gap down, the candle turns bullish and closes at a point which is more than half the size of the previous day’s candle.
This clearly depicts that the buyers have started dominating the market
How to trade using Piercing Line Candlestick Formation?
If you are a day trader, you would already know that one must avoid trading only on the basis of a pattern.
This is because the prices of a security can be affected by a variety of factors, and entering into a trade without considering other factors might lead to losses.
The patterns formed can be used to analyze a lot of things about their respective security. Though, the accuracy of your analysis can only be judged by formulating a strategy and back testing it before entering into the live market.
Initially, you might face a lot of issues while developing your strategies, but with time your analysis tends to improve, and so does your accuracy.
Before you start with formulating your strategies for trading, you must keep in mind the following points.
Doing so will help in improving your strategy that can be used for trading a piercing line pattern.
Size of the Second Candle
The size of the second candle, i.e., the bullish candle plays a very crucial role in a piercing line pattern.
As mentioned earlier, for the formation of a piercing line pattern, the second candle must close at a point that is more than half of the size of previous day’s candle.
It is not necessary for the second candle to reach the top of the previous day’s candle. The move of the candle depicts the movement in price, which tells us if the bulls were able to dominate the market or not.
A move of more than 50% represents that the bulls were not able to reverse the trend completely. However, there are very high chances of bulls taking over on a subsequent day.
Bull Divergence
While analyzing the charts, it becomes a little difficult to judge if the bulls are taking over or not.
Therefore, with the formation of a piercing line pattern, one can use various indicators that prove to be helpful.
For instance, indicators like RSI, Stochastic, and MACD can help the traders in viewing the bull divergence.
If the Bull Divergence and formation of pattern takes place simultaneously, it can be considered as a signal of a trend reversal.
Market Volume
Another essential thing to consider while trading a piercing line pattern is the market volume. By now, you would have understood the significance of the size of the bullish candle.
One must only call it a piercing line pattern if the size of the bullish candle is more than 50% of the previous candle.
This partial move represents that the bulls were not able to compensate for the total loss that happens on the previous day. However, the possibility of the prices going higher on the next day is high.
This can be judged by checking the market volume. An increase in the market volume indicates that the bulls are taking over, and the upward trend has started.
Find other important Candlestick Patterns here
Advantages of a Piercing line Candlestick Pattern
Ease of Identification: The piercing line pattern is one of the easiest charts to identify patterns while analyzing the charts.
As mentioned earlier, it includes only two candles and does not involve a lot of technicalities. Therefore, it can be easily identified and traded by all sorts of traders, even if you do not have prior experience in trading.
Risk-Reward Ratios: Calculating the risk-reward ratio is one of the most important things to do before entering into a trade.
A risk-reward ratio tells you the amount of reward you will get for the risk you are taking. A higher risk-reward ratio gives you higher returns against limited risk.
Well, that’s the case with piercing line patterns. Most piercing line patterns, if analyzed correctly, will give you trades that have a high risk-reward ratio.
Therefore, you end up making more money with the same level of risk.
Multiple Entry Points: One of the best parts about the piercing line pattern is that one does not have to worry about missing an entry point.
This is because the piercing line pattern marks the beginning of a trend reversal with a bull move.
Therefore, after confirming the trade, you can go long on the respective security once you are confident.
However, one should not wait for a very long time as it can lead to a wrong entry, and another pattern might start forming.
Turning of Piercing Line Pattern into a Bullish Engulfing Pattern
A piercing line pattern might get converted into a bullish engulfing pattern if the closing price of the second day’s candle is greater than the opening price of the previous day’s candle.
One does not have to worry about its implications as it also leads to similar effects, i.e., a trend reversal. The point to be noted here is the accuracy and intensity of reversal.
Unlike the piercing line pattern where the bulls could only partially cover the previous day’s losses, the bullish engulfing candle is formed when the bulls are able to compensate for the previous day’s losses completely.
Therefore, the bulls have come stronger this time, and they have already started dominating the market. As mentioned earlier, both patterns have a similar implication.
However, the bullish engulfing pattern leads to a stronger rally.
Conclusion – Piercing Line Candlestick Pattern
Let us now try to summarize the important points about a piercing line pattern.
- A piercing line pattern is formed during a downtrend and indicates a trend reversal as the bulls take over.
- The pattern is formed in two days using two candles. The first candle, in this case, is bearish while the second day’s candle is bullish.
- The first candle opens near day’s high and closes near day’s low. At the same time, the second candle opens with a gap up down. However, the bulls tend to take over and move the prices close to the point that is more than half of the previous day’s candle.
- The bullish candle doesn’t need to close at a price greater than the previous day’s open to form a piercing line pattern. The size of the second day’s candle tells about the dominance of the bulls in the market. If the volume increases the day after the bullish candle is formed, it can be an indication that the bulls have started to dominate, and the trend reversal might take place soon.
- If the second day’s candle, i.e., the bullish candle, closes at a price greater than the previous day’s open, the pattern changes from a piercing line to a bullish engulfing pattern. Both patterns have a similar implication of trend reversal. However, a bullish engulfing pattern tends to see a greater rally in price than it did in the piercing line pattern.
Open Demat Account in 10 Min & Start Trading Now!
Learn everything about Technical Analysis
| Learn Technical Analysis |
| How to Start Technical Analysis? |
| Best Intraday Indicators |
| Types of Technical Charts |
| Know about Resistance & Support |
| Dow Theory |
| Fibonacci Retracement |