Stochastic Oscillator – Meaning, How to Construct, Usage, Example & more
Last Updated Date: May 12, 2022Know everything about Stochastic Oscillator, a technical indicator used by many for Intraday Trading.
There are a lot of other elements that we will discuss in this article; such as the way to construct a Stochastic Oscillator and the various ideas that can impact the market as a whole.
So, let us dive in.
About Stochastic Oscillator
We all can agree to the fact that our stock market is exceptionally volatile. Therefore, it makes sense to seek help at times and prepare an adept strategy when dealing with securities.
That is when a Stochastic Oscillator is pivotal. Now, those who are wondering what that it; it is primarily an analyzing tool.
What it does is, it acts as the momentum indicator, while you compare the closing price of a security to its other ranges. Of course, the basic calculation is on a particular period.
Investors can choose to makes necessary adjustments in context with the oscillator’s sensitivity to price movements.
Aiming to reduce the sensitivity, one can make changes to the time period or choose to take a moving average of result.
So, it is the ideal solution by which you can figure out whether a stock has moved to be Overbought or Oversold.
A brief History on Stochastic Oscillator
In the late 1950s, an American Technical Analyst named George Lane designed the theories of Stochastic Oscillator. The idea was to locate the closing price of a particular stock.
So, you can figure out the high and low-price range of any stock over a period. Then, Lane discovered that the period is around 14 days.
Over the years, there are several changes in its composition, but the core idea and the construction remain the same for Stochastic Oscillator.
Let us now know more about its construction process.
Open Demat Account in 10 Min & Start Trading Now!
How to construct a Stochastic Oscillator?
The primary objective of Stochastic Oscillator is to help the traders figure out the best time to buy or sell a particular stock.
The general idea is when a stock’s price rises, it typically closes at the highest point over a period. Subsequently, if the stock’s price decreases, there are chances it will close at the lowest point at a given time.
Now, there are two major sets of numbers that explain Stochastic Oscillator:
1st Element: The first set of numbers is basically a formula, which is:
% K = 100 [(C – L of N) / (H of N – L of N)
Where,
C = The Closing Price of a particular stock which is most recent.
L of N = The Lowest Price of a particular stock traded at the N past sessions.
H of N = The Highest Price of a particular stock traded at the N past sessions.
One thing you should know that the default value of N in 14. However, it can be 14-days, 14-weeks, or even 14-hours.
2nd Element: The second set of numbers is % D. You can say is the primarily a three-period moving average of the first set of numbers – % K.
If you are an analyst, you can observe the change, which is typically between 0 to 100. Now, the concept is simple. If the Stochastic ranges above 80, you can say that the stock is Overbought.
Similarly, if % D is below 20, you can say that the stock is Oversold. Generally, a buyer sends signals if both % D and % K either goes above 80 or fall below 20.
Composition of Stochastic Oscillator
The first thing that you should notice is Stochastic Oscillator, is it ranges between 0 to 100.
So, if you want to figure out whether the stocks you purchased is Overbought or Oversold, this indicator is your real friend.
As we have already mentioned while discussing the second construction element of the tool, if the stochastics ranges above 80, it indicates an Overbought.
Similarly, anything below 20 is an Oversold. Now, what is unusual is sometimes it doesn’t follow the above rule promptly.
Meaning, if the current market trend is strong enough, you can expect an Overbought or Oversold condition for a long time.
So, what we suggest is to take some clues, if you want to predict future trends.
What a Stochastic Oscillator comprises of?
Stochastic Oscillator, first and foremost, is a chart. It contains two lines which signify the two elements that we have discussed today:
- % K: This is a green line which reflects the Oscillator’s exact value for each session.
- % D: This is a red line which shows the three-day simple moving average of the stock’s price.
The general notion is that the stock’s price follows the momentum. So, when the two lines intercept, you can say it suggests a reversal.
It is because there are massive shifts in momentum from one day to another. Many experts also believe that the point of divergence is significant.
The same applies to the trending price action as well. For instance, imagine a bearish trend that indicates a lower low which the stochastics shows a higher low; one can say it gives a vibe of a bullish reversal as the bears may be spending its momentum.
How to use Stochastic Oscillator?
Nowadays, most of the renowned charting tools use Stochastic Oscillator, and what’s more important is you can use it without putting many efforts.
The first thing that you should remember is the default time to use this tool is of 14 days. Of course, you can adjust it as per your requirement.
Now, the next step is to figure out the % K and % D that we have mentioned before. Using that, you need to determine whether the stock is an Overbought or an Oversold.
For instance, let us assume that Rs.100 is the 14-days’ high of any particular stock, and Rs.75 is the 14-days’ low price. The current close is, say, for example, Rs.85. So, we can conclude that:
(85-75) / (100-75) * 100
What the oscillator can do is to show a consistent price which closes near the recent high or low.
So, if the general reading is 80 on the charts, you can say that the stock price is already or close to Overbought area.
Various Trading Ideas using Stochastic Oscillator
Before we dive into the various trading ideas using Stochastic Oscillator, we would like to tell you that there are several misconceptions of overbought and oversold.
In fact, many experts believe it is one of the biggest flaws of the stock market today. That is the reason we insist you to use Stochastic Oscillator, in the first place.
Now, let us check some of the Trading Techniques.
Trending
Stochastic Oscillator is very helpful to determine the market trend.
The way to figure out whether or not the market trend is still intact, you should keep an eye on the stochastics and it should cross in one particular direction.
You can say the trend is getting stronger if the intercepting line crosses 50 on the table.
Breakout
Using Stochastic Oscillator for Breakout trading technique is yet another popular ploy.
For those who don’t know what the Breakout technique is; it is a point where it signals that a new trend is emerging in the market.
The concept is when the Stochastics accelerates out of nowhere into one particular direction while the two bands are stretching, it reaches a breaking point.
From that point onwards, there is a strong possibility that a new trend will emerge. Now, if in case, the breaking out price tag along with the sideways range, it becomes merrier.
Expert traders can then locate the breakout on oscillators using the latest trend line and can start a new Breakout trade.
Breakdown
As Stochastic Oscillator is an adept tool for the Breakout trades, it is equally competent in case of a Breakdown trade.
The traders can see a reversal, while the stochastics are altering direction. However, it should be in a position where it leaves the Overbought or Oversold zone.
If you wish, you can also add a particular stochastic using the trend line or by moving averages.
The idea is to observe whether the green stochastic line crosses over the red line, and when it leaves the area, you can say that it is a bullish reversal. So, having such a tool is helpful, indeed.
Divergence
Stochastic Oscillator is an incredible tool to figure out if there are any divergences that we can observe.
We know that it is very common in momentum indicators that they generate Divergences. It shows that there might be a change in the trend.
However, it also signals the end of a trend at times.
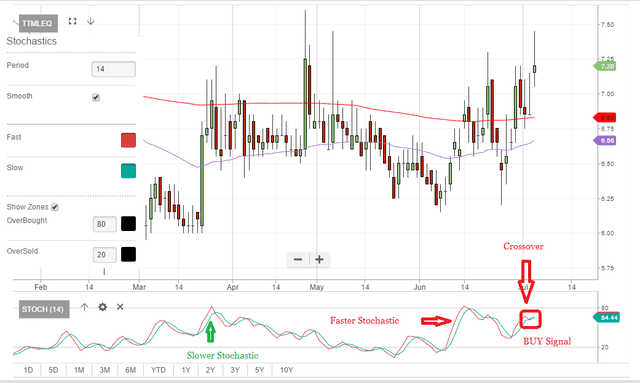
Crossover
By this trading technique, you can figure out the appropriate time to buy or sell a stock. For that, you need to observe that status of the %K Stochastic of when it crosses over the %D Stochastic.
So, when such a phenomenon occurs, you should buy that particular stock. Similarly, when the opposite thing happens, you should get rid of your stocks as soon as possible.
Conclusion – Stochastic Oscillator Indicator
So, there you have it. We have wrapped up the basics of Stochastic Oscillator. To conclude, it is an incredible tool created in the late 50s to assist traders.
It seems amazing that the concept still works today. So, it makes sense we should carry on using this idea to maximize profit margins.
Open Demat Account in 10 Min & Start Trading Now!
Most Read Articles