Advance Decline Line or A/D Line – Meaning, Formula, Divergence, Limitation & more.
Last Updated Date: Nov 15, 2022A/D line, an acronym of Advance Decline Line, is a breadth indicator that provides the trader with an idea about the stock participants in the stock market and measures its strength.
When mostly indices are frequently declining, a falling A/D line depicts a downtrend.
On the contrary, if mostly indices are declining but the Advance/Decline line is frequently rising, and the decline in fewer stocks is observed over time, it implies that the indexes are likely to decline.
In AD line, Bullish or bearish divergences signal a significant change in the participation that warns a trader about the reversal before time.
Few limitations with the Advance/ Decline line are also notable, especially in NASDAQ stocks, A/D line never provides accurate data.
Few indices are market-capitalized-weighted which empowers some more prominent companies to bring change in Index’s movements.
About Advance Decline Line
When it comes to Technical Analysis of the trading environment, you might have heard about lots of popular technical indicators, and this Advanced/Decline Line is one of them.
Across traders, it’s a widely used indicator that measures market breadth; also pronounced as AD line.
Initially, this ‘indicator’ was applied to the New York Stock Exchange (NYSE) only, but over time, this technical indicator increasingly started being utilized across other exchanges and indices for the smaller stock market.
Open Demat Account in 10 Min & Start Trading Now!
Understanding the Advance/Decline Line
The history of Advanced Decline Line dates back to 1930, though the indicator got a big boost when Richard Russell in 1960s started using it.
As opposed to market index movement, the A/D line is supposed to be more useful to measure the stock market’s ever-changing strength.
However, when a trader wants to get an idea about the overall market strength, AD line is quite fruitful.
When irrespective of declining the stocks are only advancing, so this indicates that the A/D line will go up (or vice-versa).
Mostly traders accept that A/D line can provide a perfect vision of market strength as compared to standard indices, e.g., S&P index or DJIA (Dow Jones Industrial Average).
An in-depth study of A/D Line can provide the analysts with a comprehensive overview of the rising and falling trend in the market. For how long the trend will stay or vanish, it outlines the exact figures.
AD line provides investors with an insightful indication thoroughly about the participation of the entire stocks in a specific index in the market’s direction.
For instance- if a capitalization-weighted stock index (such as the DJIA, S&P 500, and the NASDAQ Composite) rose by 3%, it will become essential for the investor to get an insight into the Index.
The rise in the Index is possible because the majority of the stocks are gliding up or strong performance of a company can also be the leading reason.
Advance Decline Line Formula
The formula below is used to calculate the Advance/Decline Line.
Advance – Decline Line = Advancing Stocks – Declining Stocks + Previous Net Advances
Here-
- Advancing stocks are representing the number of ‘stocks’ daily growing in value.
- Declining Stocks is representing the number of ‘stocks’ daily decreasing in value.
- Previous Net Advanced is representing the “advancing and declining stocks” net amount on a daily basis.
The Advance Decline Line in Trend Trading
As said before, unlike the normal trading, the Advance/Decline line gauges the differences that lie between two indexes.
Besides, A/D line provides an overview of the issues gliding up or down (‘issues’ refers to stocks)
Advancing Issues Vs. Declining Issues
While analyzing the advancing issues, you’re only analyzing the numbers of stocks gliding up.
Although, the advancing issues index can either move in the similar or other direction as opposed to Volume and this happens for the reason that the stocks’ group is moving up, that consists of varied sizes (traded number of shares).
Although you can also find stocks moving up in an extensive amount, the Index can significantly be moving down if these stocks are indeed the small caps.
However, since the count of ‘stocks’ moving down is relatively minimal, so the probabilities are high that these stocks can trade more Volume as compared to the stocks moving up.
On the other hand, the declining issues Index solely monitor the number of stocks gliding down despite worrying about the stocks’ Volume.
Advancing and Declining Signals: Differences
While evaluating the difference between up and down volume indexes if you have noticed the type of signals, so the same types of signals you get in the advancing and declining issues through the same process.
However, the A/D line is often deemed with more ‘up and down, swings’ as compared to the ‘up and down volume index.’
Just like you do with other indicators, you can also Plot A/D line as a bar and simultaneously apply an exponential moving average of a 20-period.
(The term Period is used in the context of Numbers of Bars featuring on the chart utilized to evaluate the ‘average’)
Interpretation of A/D Line
The AD Line keeps the track record of the degree of participation in either advance or decline situation.
The Advance Decline Line, which increases and tracks new highs together with the overall Index indicates effective stock participation that is bullish.
On the other hand, the AD Line, which struggles to stay consistent with the general Index and shows new highs, reflects narrowing engagement. However, it also implies that Market strength is weakened as fewer stocks engage in advance.
Narrowing engagement or participation is also defined as a bearish divergence within both the AD Line as well as the accompanying Index.
In the flip side, the market is deemed sluggish as the AD line keeps moving to a new high alongside the underlying Index. This represents extensive participation within the decline phase.
However, a bullish divergence arises once the AD line slips up on acknowledging the lower low together with the Index.
Similarly, this directly implies that stocks are declining in a fewer amount. And the decline within the Index might have been getting near to an end.
Bullish Divergence in AD Line
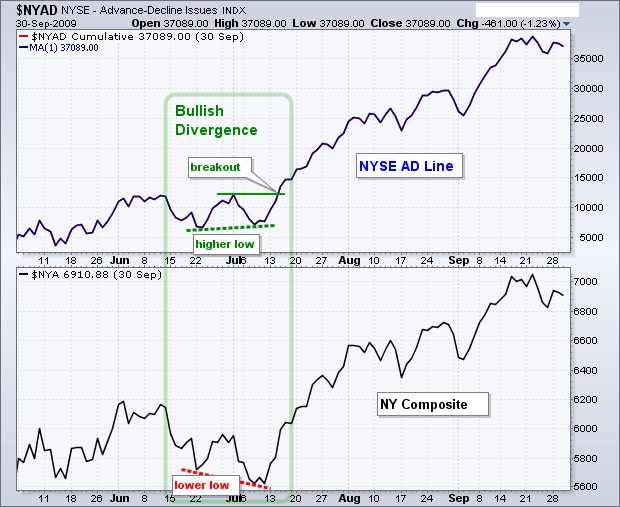
In the above chart, you can see the bullish divergence highlighted in green on the NYSE AD Line.
Since the NYSE AD Line is focused on sophisticated NYSE data, it makes logical sense to contrast its value with the NYSE Composite.
For instance, the bullish divergence was created in June-July 2009, and this happened when the NYSE Composite dropped well below lows in June, and the NYSE AD Line though created a higher low.
Even though this marked bullish divergence is very slight and spans just a couple weeks of trading, still it was highlighting a significant low in July 2009.
The NYSE Composite progressed more than 10% from all its lows in July and can be observed some of its peaks in August.
Significantly bigger bullish divergences between October 2002 to March 2003 can be seen and somewhat between May 2004 to the beginning of August 2004 is also clearly visible.
Bearish Divergence in AD Line
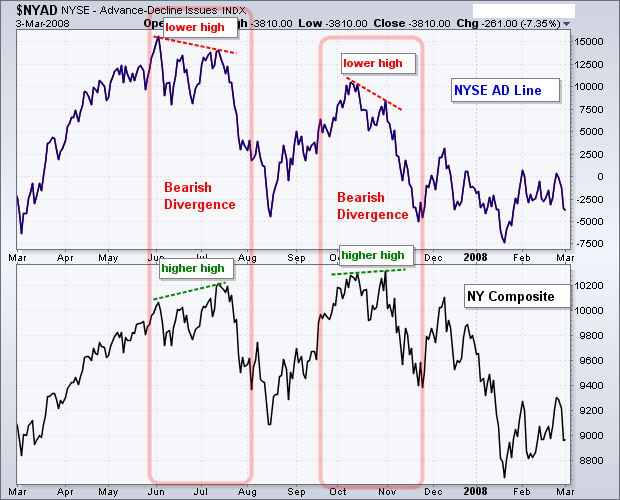
In the above chart, you can see bearish divergences in two red blocks in the NYSE AD line with date June-November 2007.
The NYSE Composite jumped to a new high and was on its peak in July, on the other hand, if you look at the AD Line, so it peaked near about June.
On July 2007, the lower level in the AD Line identified the initial bearish divergence, and this is because of the reason that breadth could not support the Index.
The NYSE Composite began to rise once more to a new high near in October, but the AD Line suddenly starts to fall from its July peak, forming bearish divergence one more time in October. In particular, there are two substantial bearish variations on performance here.
After that, the AD Line failed to cross its summer high. Similarly, the AD Line developed a lower high, from the beginning of October to the end of October.
As you can see, NYSE Composite also forging higher high throughout these periods, the bearish divergences start coming into shape for the reason as the ‘breadth’ couldn’t be confirmed.
Limitations of A/D line Indicator
Apart from all these crucial insights, there’re few things in the context of A/D line limitations you must be aware of. Few indexes are market-capitalized-weighted.
And this implies if the company is big enough, it can easily trigger a considerable impact over the Index’s movement.
Also, the A/D line grants similar weight to almost all stocks. That’s why, it’s a perfect gauge of the mid-cap stock, irrespective of mega-cap ‘stocks’ are fewer or in a large number.
However, in regards to NASDAQ stocks, the Advance-Decline line don’t provide accurate readings for all time; thus, it may create a bit of trouble for the traders.
Conclusion – Advance Decline Line
Ultimately, now you’ve covered all the necessary information about the Advance/Decline line, which is considered a useful breadth indicator is reflecting the number of stocks participating in the market.
How a broad-based advance displays the strength of the ‘stocks’ and, how ‘narrow advance’ of the advance/decline line indicators portray a mixed market, we’ve discussed everything in this article.
The Bullish formed divergences can assist the analysts in having a deep insight into the potential reversals in the Index of A/D line indicator.
Open Demat Account in 10 Min & Start Trading Now!
Most Read Articles