Moving Averages – Meaning, How it Works, Types, Examples & more
Last Updated Date: Nov 17, 2022In this article, we’ll cover descriptive information about moving averages – an extensively used technical indicator and its vivid types, and how analysts bring Moving Average into action through various calculations.
To identify the ‘trend direction’ followed by a comprehensive study on the traditional prices and trends, the ‘Moving Average’ smoothens up current data.
A longer moving average is beneficial compared to a short moving average, which causes sensitivity and leads to lots of faults.
A triangular moving average provides double smoother data because it figures out the middle sections irrespective of the past and latest trends.
About Moving Averages
When it comes to Technical Analysis, we often dissert about Moving Averages (a fundamental indicator). It’s also recognized as the oldest technical indicators.
For the market analysis, Moving Average is the best approach used by technical analysts. To get an idea about the latest trend, technical analysts use Moving Average, which helps them a lot in the volatile markets.
In a ‘smooth manner,’ MA provides a clear insight into the stock/security trend at a varying price with less apparent volatility. Moving Average is also identified as a foundation of other conjunctions, such as- MACD (Moving Average Convergence Divergence).
But this technical indicator doesn’t predict the direction of the price; indeed, it states precisely about the current direction followed by past prices. Next, we’ll go into the Moving Averages types for a thorough discussion.
Open Demat Account in 10 Min & Start Trading Now!
Types of Moving Averages
Here are various types of moving averages used as Intraday Indicator or Technical Indicator.
Simple Moving Average
Simple Moving Average, in short, “SMA” is the average introductory price reported in a particular timeframe.
For instance- in a simple moving average calculation, be it 10 days or 50 days, the analysts add the cost of 10/50 days and divide this number by 10 or 50 days.
Similarly, in the next day’s calculation, analysts drop the previous data and add the new data. In this way, they recalculate the average, and the process goes repetitively on.
Subsequently, in Simple Moving Average, the series of points are then aligned to create a line.
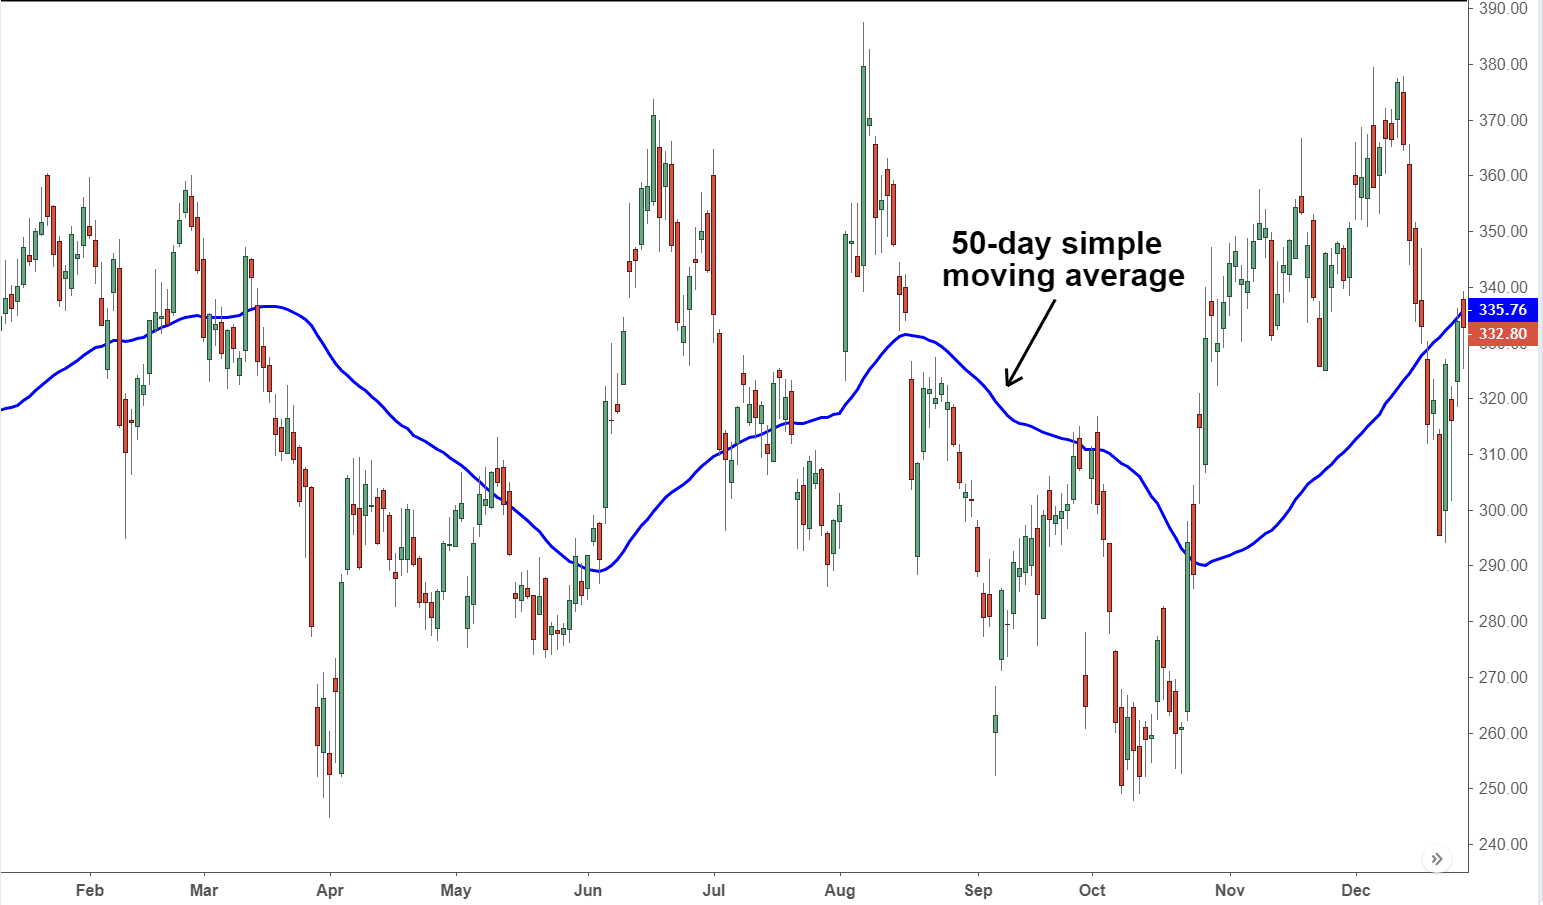
The above data is the best example of how 50-period SMA has been plotted on the S&P 500 daily chart.
The moving average is defining the positive slop of price in the particular market uptrend. However, in the uptrend, the price is supposed to be above the moving averages, because the varying lower prices are likely to be back into the study of earlier trends.
Simultaneously, in the downtrend, the condition will go opposite, the slop will drop negatively, and the price will also fall below the Moving Average.
Learn everything about Technical Analysis & make for money in stock market
Exponential Moving Average
Exponential Moving Average also referred to as “EMA,” is quite popular among traders. It’s somewhat similar to Weighted Moving Average but rather different because it follows different calculations.
For instance, it gives more importance to giving weight to the latest data points as compared to previous data points.
By going this way, the Exponential Moving Average captures the recent trends effectively and swiftly. Relative to SMA, EMA reacts more quickly and is apt in providing an early signal to the analysts.
In both SMA and EMA periods, traders commonly plot 50, 100, and 200 to track price action in the preceding years or months.
However, the ‘Moving Average’ calculation on short-terms 12 and 26 days is quite popular, especially in the MACD indicator.
Weighted Moving Average
In the Weighted Moving Average, the weighting factor is more dominant.
It focuses more on weighing on the latest data points and less on past data points. Subsequently, each observation is then multiplied in the data on the base of the predetermined weighting factor.
It generates signals for the traders when to buy a stock or initiate selling. However, WMA is brought into action when figures in the data set are varying.
However, as compared to Simple Average Prices, WMA recognizes prices more deeply.
You can calculate the weighted Moving Average by using the formula.

Here-
N refers to the ‘time period.’
Triangular Moving Average
In triangular Moving Average, a trader gets insight into the prices of assets. It provides double smoother data as compared to exponential and weighted average schemes.
In WMA and EMA, the majority of the focus is made on recent data weighting, but Triangular Moving Average is entirely different.
In addition to the recent data point, it focuses on the middle sections, (thus it finds out average twice).
Uses of Triangular Moving Average
The Triangular Moving Average uses are also quite significant. As compared to other calculations, TMA double smoothes the data providing clear insight into the price.
However, the presented line of TMA reacts slowly as compared to SMA. But this reaction can be beneficial or problematic, too; thus, it’s also ground upon the trader’s selection.
In short, for what and how they are using it.
In ‘volatile market conditions,’ TMA doesn’t react fast, it takes a longer time, but it also benefits the users.
For instance, the price can fluctuate over time; thus, it provides sufficient time to the user with a clear vision on the right time to buy or sell the stock.
Time Series Moving Average
TSMA or Time Series Moving Average utilizes linear regression techniques to provide the user with smooth data points.
For instance- in Time Series Moving Average, rather than plotting the regression line into a straight linear manner, the TSMA plots only the endpoints stated on the line.
The plotting is done within specified numbers of periods. Ultimately, the user then connects all the points and creates a line to conclude the Timer Series of Moving Average.
Apart from EMA and SMA, various other moving averages also include the following types in Technical Analysis.
Variable Moving Average
In Variable Moving Average, a user becomes more creative and finds out the moving averages differently. For instance, it follows three moving averages (normal, exponential, and smoothed)
VIDYA Moving Average
Variable Index Dynamic Average is somewhat similar to Exponential Moving Average; indeed, it’s an original method for calculating EMA. It is mainly focused on the changing periods of average.
Welles Wilder Moving Average
It’s also similar to Exponential Moving Average, but comparatively, it reacts slowly.
Why use Moving Average?
A moving average eliminates the confusion (in terms of information or activity) and provides a clear idea to the analyst on the ‘Price Chart.’
For instance, it gives you a basic idea about the price direction, like how it is going. In a nutshell, the price is elevating if MA is angled up, the price is falling if MA is angled down.
With the help of a comprehensive statistical analysis, creating a series of average values belonging to varying subsets; a user creates an idea about the long-term trends.
The traders follow this study to settle on buying or selling stock/security.
The Sensitivity of Moving Averages
Shorter Moving Averages leads to sensitivity. For instance- a moving Average of 5 days will be considered sensitive as compared to a moving average of 20 days.
However, analysts encounter problems with moving average in the short term because it includes extensive false moves.
Although 3 days, 6 days, and 12 days, short moving averages are suitable for commodities, on the other hand, when it comes to stocks, 10, 30, 50, 100, or 200 days are more effective. However, the selection of days also depends upon a moving average user.
For example- a positional trader or short term trader takes the ultimate decision. However, it also depends upon variations in the market, i.e., is it trending or not?
Holding capacity also influences the moving average.
How Moving Average Works?
The most important applications of moving average include its ability to identify a trend and its direction, determine support and resistance levels.
This identification of a trader’s willingness to buy a stock increases when the stock price trades above its average price.
Similarly, when the stock prices trade below the average price, it means traders are looking forward to selling the stock at a lower price than the average price.
In both the cases mentioned above, the first case encourages traders to indulge in buying opportunities whereas; in the second case they must look at selling opportunities.
Based on these conditions, it is possible to develop a trading system that helps traders identify the entry and exit points with a set of rules. A good trading system gives a signal to enter a trade and a signal to close out the trade.
Some characteristics that come with moving averages in technical analysis include:
- Moving averages provide trading signals only when the market moves sideways.
- Identifies security that displays trending.
- It helps to cut down the noise on the price chart.
- The rising moving average indicates an uptrend.
- The declining moving average indicates a downtrend.
- Upward momentum comes with a bullish crossover
- Downward momentum comes with a bearish crossover.
- Difficult to find out a big winner from many small trades.
- Provides marginal profits, not losses.
- Applicable as a proxy to identify profit in long-term investment.
Rules of using Moving Average
Let’s consider a 50 day exponential moving average example of such a trading system with the following rules:
Rule 1 of Moving Averages
Buy (go long) stock when the market’s current price is greater than the long-term EMA of 50 days.
Rule 2 of Moving Averages
Exit the long position when the current market price is less than the short-term EMA of 50 days.
Later apply a Moving Average crossover system on that trade. It will reflect the terms and its functioning to keep the trader aware of possible losses that might occur and thereby not allowing its occurrence.
It is most widely in use and the calculation remains the same even in the short-term, medium-term, and long-term trends.
The terms are in categories on the moving average length out of a Fibonacci series.
Example of Moving Averages
For example, to analyze the short-term trend, traders use the average between 13 to 21 days, 34 to 55 days for the medium-term, and 89 to 144 days for the long-term.
The terms extending the long-term also exist with the duration between 233, 337, 610, and 987-day moving averages.
But, longer the time frame, lesser the number of trading signals. So traders have to choose wisely the term period of their trade’s moving average.
Another topic of concern is the durability of a moving average. It works efficiently as long as there is a trend, irrespective of the time frame traders apply.
It is important to keep in mind that it is a trend following system that reflects only on the presence of a trend.
Price Crossover
On the Trading Chart, the Crossover is the specific point where both stock/security and a technical indicator (Moving Average) line intersect.
However, it can also happen when two indicators intersect, creating a crossover.
Disadvantages of Moving Averages
The most significant disadvantage of Moving Averages is the assumption that the market becomes too trending in most instances.
Also, numerous fluctuations in the market lead to delay in the signals, which create a disturbance in entry and exit data points. Understand it thoroughly by taking a glance at the example stated below.
In the above-stated example, the ‘cross over system’ below on the moving average has grabbed some big moves.
Most notably in the trending phase, it furthermore introduced losses in the Non-trending face in the Nifty50.
Moving Average – Conclusion
So, this was all about how Moving Average supports a trader and provides them with a visible indication. Such as where and how the price will fall after a brief analysis of ongoing and previous trends on the market.
When multiple moving averages are brought together for calculation, it becomes more powerful. Simultaneously, it delivers successful results at the traders’ end. The most basic indicators are Simple Moving Average and Exponential Moving Average.
But the Moving Average calculation works only for the trend-following systems. Still, it’s the best way to stand out in the trading sector.
How the rate changes, magnitude, and trend’s direction allow a user to get a clear insight into the trading environment on a broader system.
Simultaneously, a user obtains a competitive edge in the market through a profitable and useful technical analysis.
Open Demat Account in 10 Min & Start Trading Now!
Most Read Articles