Relative Strength Index or RSI – Meaning, Formula, Calculation, Usage in Trading & more
Last Updated Date: May 12, 2022If you are new to the technical terms, then you don’t need to worry at all, as we have put together all the useful information in this guide. The blog mainly guides users to use the Relative Strength Index or RSI Indicator and why they should use it.
But before you dig into the topic, you should know the basics of technical analysis. Ideally, technical analysis is a process where you can predict the price movement and future market trends.
It can be done by studying some charts of the last market action and evaluate the performance by comparing it with the current market trends.
Basically, technical analysis is concerned with what has happened in the past and what might happen or take place in the near future.
One of the best parts of technical analysis is that experts suggest that they can easily follow many markets and market instruments at the same time.
About Relative Strength Index or RSI
Basically, RSI or relative strength index is used in technical analysis. It is nothing but a momentum indicator that helps in measuring the magnitude of some price changes recently.
The main agenda of this indicator is to analyze overbought or oversold conditions with regards to the price of assets or stock.
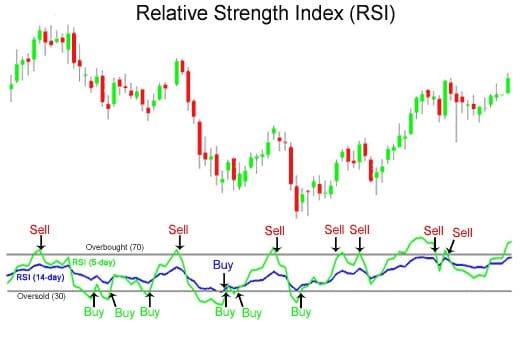
The RSI is mainly portrayed as an oscillator. It is a graph that moves between two extreme points. The graph has a reading from 0 to 100. J. Welles Wilder Jr. had introduced this indicator back in 1978 in his book known as New Concepts in Technical Trading Systems.”
Generally, When the indicator is 70, it is known that RSI is overbought, and when it is 30, it is said that RSI is oversold. By looking for divergences and failure swings, signals can be developed.
Open Demat Account in 10 Min & Start Trading Now!
Formula for RSI or Relative Strength Index
RSI = 100 – (100/1+RS)
Here, RS is the relative strength, which is the Average of X days up closes / Average of X days down closes.
To calculate the initial RSI value generally, 14 days period is used, but the analyst is free to choose the number of days for calculating RSI.
For example, during the 14 day period, it can be assumed that the stock will generate optimistic returns for the first nine days and pessimistic returns for the remaining five days.
So in such a case, you can calculate the ROI as follows:
- You need to calculate the gains for the nine days, and after adding the absolute gains, you need to divide it by 14. By doing so, you can figure the average up closes.
- For the five days, you need to calculate the total loss and divide the same by 14. By doing so, you can determine the average down closes.
- To get the relative strength, you need to divide the average up closes or gains by average down closes.
- You can normalize the figure using the given formula and make sure that it lies between 0 and 100.
Learn more about the RSI Parameters
For RSI, the default lookback period is 14 days, but to increase or decrease the sensitivity, it can be lowered or raised, respectively.
As compared to 20 days RSI, the ten-day RSI might touch the overbought or oversold levels. Mainly, the lookback parameters depend upon the volatility of the security.
When RSI is more than 70, it is considered overbought, and when it is below 30, it is deemed to be oversold.
These are some traditional levels which can be altered easily to meet both security and analytical requirements.
If you want to reduce the number of overbought or oversold readings, then the RSI needs to be raised to 80 or lowered down to 20.
Short term traders use two-period RSI to look for overbought readings more than 80 and oversold when readings dip down to 20 or low.
What do you mean by overbought and oversold in RSI?
It is but evident that you might be wondering after reading the RSI parameters that what is overbought and oversold and how does it ideally work? When it comes to marketing and trading signals, when the RSI is above 30, then it is a bullish indicator.
While on the contradictory terms, when the RSI dips below 70, then it is addressed as the bearish indicator.
When indicator touches 80 and 20, it is also known to be overbought and oversold as some assets tend to be more volatile and quick as compared to others.
How can RSI help in Trading?
The RSI indicators seem to remain more stable during the uptrends as compared to the downtrends. It is truly worth it because RSI measures gains against losses.
There will be more gains in an uptrend, which mainly keeps the RSI at higher levels. The RSI will stay at lower levels during a downtrend.
The RSI will be above 30 during an uptrend and might often hit 70. RSI exceeds 70 during a downtrend in rare cases, but indeed the indicator hits 30 or below. You can use these guidelines to understand the strength and on spot reversals.
For instance, if the RSI fails to reach 70 during an uptrend but drops below 30, then you should know that trend has weakened and would also be reversing lower.
For a downtrend, the reverse tends to be true. If the downtrend doesn’t reach 30 or below, then it might rally above 70 but then hits below 30, it indicates that the downtrend has weakened and might reversing to the upside.
Important Roles of Relative Strength Index
Trendline Application – It is a fantastic fact to know that the relative strength index and closing chart go hand in hand.
Sometimes, it is challenging to identify which one is the closing chart and which one is RSI. These trending lines are applied in the closing chart either up or down.
Pattern Breakout – One of the most exciting phenomena in the building of the chart is the formation of a pattern.
Be it a reversal or continuation pattern, and it will indeed breakout at a specific point of time.
Additionally, it is interesting to learn that RSI takes into account the underlying relative strength of a stock over a specified duration.
You need to know that such breakouts take place 2-4 days in prior in RSI; the due course will be followed by price.
Role of 50 – The mid 50 line tends to as a vital line to indicate the price of direction in the relative strength index.
Usually, it is seen that the price continues to stay above the 50 lines during the bullish market phase. On the other hand, in the bearish phase, it faces robust resistance from the 50 lines.
Thus, you need to know that there are several whipsaws in the daily chart, so it is highly recommendable to look at the giant timeframe chart like the weekly chart.
Failure Swing – When the RSI moves hits 30 or less, a bullish failure swing forms. When RSI bounces 30, it pulls back and holds and then breaks the prior high.
It is an indicator to turn to oversold levels.
What is the difference between RSI vs MACD?
Similar to RSI, MACD, or moving average convergence divergence is a trend-following momentum indicator that tends to portray the relationship between two moving averages of the price of the asset.
Ideally, MACD is calculated by subtracting the 26 periods exponential moving average from the standard 12-period exponential moving average. MACD line is the result of the calculation.
The signal line is known as the nine days EMA of the MACD. The same sequence is then plotted on the pitch of the MACD line that functions as an indicator for buy and sells signals.
When the MACD crosses the signal line, the traders might end up buying the security. The traders tend to sell security when the MACD hits below the signal line.
Limitations of Relative Strength Index
As majority of the indicators, the signals given by RSI are mostly trustworthy when they get along with the long-term trend. Under this rarely, the true reversal signs are seen, and it could be challenging to separate the false alarms.
Thus, RSI can be most beneficial in an oscillating market where the price of the asset adjusts between bearish and bullish movements.
Conclusion: Relative Strength Index or RSI
RSI is an essential tool used by people to ensure that the indicator’s readings are correctly understood. It is better known as the market technician.
Under the finance niche, the relative strength index or RSI is a type of indicator that tends to keep a watch over the pace of the recent price changes so one can determine if they can sell or buy the stock.
Mainly the tool is used by the majority of the market traders and statisticians as it is a technical indicator that helps in identifying the opportunities to enter or exit the market.
Just like other indicators, the signal quality of RSI is mainly based upon the features of the underlying stock.
Additionally, if you want to generate better and more confirmed trading signals, then you should use RSI in conjunction with other parameters and indicators.
RSI is known to be one of the most versatile indicators that have stood the test of time. RSI remains constant despite the alterations in the market.
Open Demat Account in 10 Min & Start Trading Now!
Most Read Articles