Moving Average Convergence Divergence or MACD – Meaning, Pattern, Divergence, Drawback & more
Last Updated Date: Nov 17, 2022Moving Average Convergence Divergence or MACD provides the quantitative study of stocks when subtracting 26-period from 12-period EMA (Exponential Moving Average).
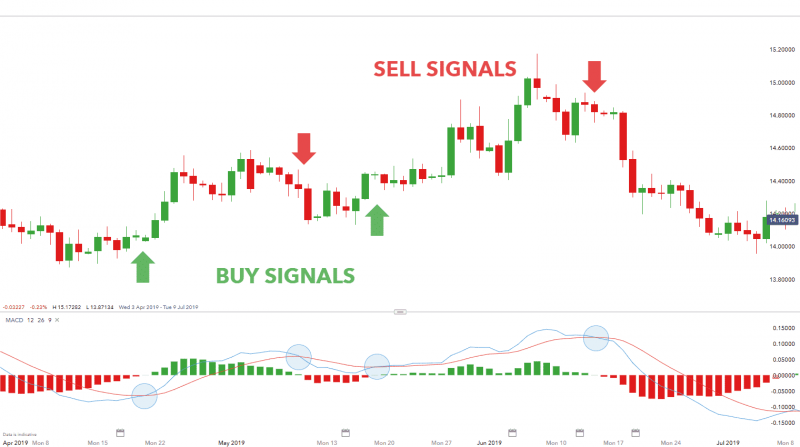
- MACD indicates Technical Signals when it crosses above ‘buy line or sell line.’
- MACD supports investor opinion in understanding the bullish or bearish movement that helps them in getting an insight into the price, e.g. if it’s strengthening or weakening.
- The initial method of understanding the MACD becomes more effective with moving average crossovers.
- Observe the buying and selling signals in the MACD Moving Average Crossovers in the Nasdaq 100 Exchange Traded Fund chart (QQQQ).
The stock market is a huge and complicated place where smart investors can earn a colossal amount. Hundreds of companies try to raise funds in the stock market by offering investors shares in return.
But, as an investor, substantial research is highly required before initiating any investment. The research can include reading financial statements of the company, trading charts, and checking of overall performance.
Similarly, for the proper analysis, you’ll come across some technical terms and Moving Average Convergence Divergence or MACD is one of them.
In this article, we’ll cover the major points related to MACD and how does it help in the trading environment.
What is MACD or Moving Average Convergence Divergence?
The MACD (Moving Average Convergence Divergence) also pronounced as a “mac-dee” is a useful tool for the technical analysis.
Designed by Gerald Appel, at the end of the 1970s, the MACD oscillator is known to be a potent and responsive momentum indicator.
Moving Average Convergence Divergence is a trading indicator popularly utilized for the quantitative study of stock prices.
The metric allows analysts to identify the momentum, directional changes, span and strength of a trend in the stock’s price.
Similarly, this indicator can also be used for its price reversal qualities alongside ‘trend following’ traits. It’s calculated by subtracting 26-period from 12-period EMA (Exponential Moving Average).
Open Demat Account in 10 Min & Start Trading Now!
Meaning of “Moving Average Convergence Divergence”
You can find Moving Average Convergence Divergence somewhat similar to the Moving Averages, but it is not.
Convergence few traits relate with the phase when two moving averages tends to intermix. It signifies a change in trend is on the way to come.
Divergence is also split up into two definitions. For instance, it implies that the two moving averages are moving apart or else the security’s trend is strengthening.
You’ve also viewed Divergence as a discrepancy between the MACD line and price, which is also the most valuable attribute of trading.
For example- the MACD line is declining but the hike in price is being observed (also identified as “bearish divergence” or “negative divergence”) so this indicates that any time the price can drop.
On the other hand, if a new low is observed in the price and increase in MACD line (also called “bullish divergence” or “positive divergence”), this perhaps indicates a price rise is likely to come.
How MACD Indicator works?
Now you’ve obtained a clear insight into the MACD and cleared the doubts related to the MACD in stocks, but now it’s the time to glance at the working parameters of MACD.
In particular, MACD is recognized as an oscillator which depicts how the trend is going on, its strength and reversal.
In a nutshell, Moving Average Divergence Convergence provides a comprehensive insight to the trader about the on-going variations in the market following the references from historical patterns.
However, the MACD indicator, in general, is likely to convert three moving averages frequently into two moving averages.
In order to reassure the oscillator to recent market fluctuations, analysts use the EMAs (exponential moving average).
The Moving Average Convergence Divergence is supposed to be a contrast between moving averages of fast and slow types.
EMA is a particular type of moving average that gives the more recent data point greater importance and weight. The EMA is often called a moving average that is uniformly weighted.
However, the EWMA responds even more intensely than its slow-moving average, which also similarly weighs all measurements, to the current price adjustments.
MACD Moving Average Crossovers
The preferred way of understanding the MACD becomes more effective with moving average crossovers.
Because when 12-period (shorter-term) exponential moving average (EMA) exceeds the 26-period EMA (longer-term), a possible buying signal is likely to occur.
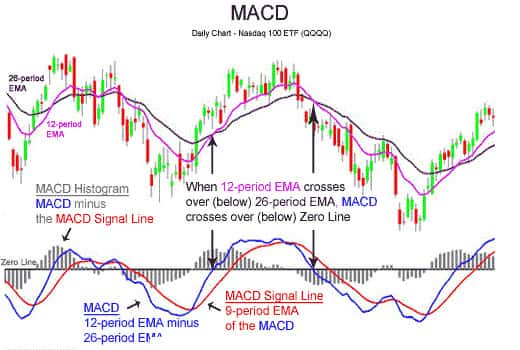
This can be observed with the two purple lines in the “Nasdaq 100 Exchange Traded Fund chart” highlighted below-
You should notice that the MACD line (highlighted in blue line) is formed from the 26-period EMA and 12-period.
As a result, when the 12-period (deemed shorter-term) EMA jumps over the 26-period EMA (deemed longer-term) the MACD line jumps over the Zero line.
On the other hand, if the shorter-term EMA 12-period tackles below the longer-term EMA 26-period, the Moving Average Divergence Convergence line simultaneously then passes below the Zero line.
Potential Buy Signal of Moving Average Cross Over
The probability of the buy signal is high when the blue line (MACD line) jumps over the zero lines.
Potential Sell Signal of Moving Average Crossover
Moving Average Crossover signifies Potential Sell Signal in the situation when MACD crosses well beneath the zero lines which trigger a potential sell signal.
Preceding possible purchasing and selling signals can provide an idea to the individual to trade in the stock after some time. Another possible ‘buying and selling signal’ can be observed in the graph below.
Moving Average Convergence Divergence Potential Buy Signal
The probability of the buy signal is high when the blue line (MACD line) jumps over the red line (MACD signal line).
MACD Potential Sell Signal
Likewise, once the MACD arches below Moving Average Divergence Convergence Signal Line, a potential signal indicates that the sell probabilities are high.
Although, the MACD moving average crossover is deemed one of the effective ways of understanding the MACD – a popular technical indicator.
On the other hand, if we briefly talk about MACD divergence and histogram, so these signals are two other means to bring MACD effectively into action.
MACD Histogram
The disparity between the MACD line (red line) as well as the MACD line (blue line) is referred to as the MACD Histogram. You can see the MACD histogram in the below Nasdaq 100 QQQQ chart- :

Two essential terms, taken from “MACD histogram” can be seen in the QQQQ chart illustrated above:
Convergence
The MACD histogram gets smaller in peak. And this is happening because there is a transition of direction or a downturn in the trend of stock, bond, future, or currency.
If this happens, the MACD line is adjoining to the signal line of MACD.
Divergence
The MACD histogram is rising in height (which is likely to be possible in favourable or unfavourable directions).
This is for a reason, as the MACD is rising way quicker than the duration of the current industry trend.
When the future, stock, or currency pair moves in a substantial direction, the MACD histogram is likely to step up in height.
On the other hand, if the MACD histogram fails to rise in height and suddenly starts to shrink, the economy is likely to be facing a slowdown; thus it warns the trader with the possible indication of a reversal.
MACD Divergence
Bearish Divergence is likely to arise when an indicator for technical analysis (like of MACD) is suggesting the trader regarding the price which is likely to drop, still the price of currency pair, future and stock are constant over their uptrend.
Bullish Divergence is likely to arise when any indicator is providing a signal that price needs to stay at the bottom and rising higher. Still, the original price tends to move downward.
On the base of these divergences, a trader gets an overview of the market that helps them to come across the decision of getting out of the position before they bear losses.
Drawbacks of MACD Indicator
The drawbacks of MACD are also well-noticeable. If we briefly talk, so the biggest downside on bringing this indicator into action is that, while producing transaction signals an investor will get poorly hit around the position multiple times before catching a strong transition in momentum.
Similarly, as you can notice in the chart stated below, the sluggish component of this index may produce a variety of transaction signals over a ‘lengthy move,’ but this also allows the trader to fully understand several more lackluster gains or even minor losses mostly during a rally.
Traders should be mindful that the whipsaw phenomenon can be extreme in both range-bound and trending markets since comparatively minor changes can lead to change in directions of the indicator rapidly.
On the other hand, the massive false signals can also raise losses for a trader. Meanwhile, if commissions are taken into consideration to execute the equation, the whole analysis becomes very costly.
Furthermore, MACD sometimes fails to understand the traits of distinction between securities, so these situations indicate few drawbacks of MACD.
Conclusion – MACD or Moving Average Convergence Divergence
Overall, if we sum up the traits of MACD indicator, so despite few shortcomings, it’s a significant technical analysis tool. It allows the traders to have a comprehensive overview of the trend direction instantly.
Clear transaction signals can lead to successful trading, whereas the crosses moving over the signal line ensures that trader is initiating the right trading in the right momentum direction.
Most of the technical analysts believe that it’s one of the quickest and reliable technical indicators. One of the best for short term trading strategies.
Open Demat Account in 10 Min & Start Trading Now!
Most Read Articles