Commodity Channel Index or CCI – Meaning, Usage, Divergences, Limitations & more
Last Updated Date: Nov 16, 2022Commodity Channel Index or CCI Indicator (Designed by Donald Lambert in 1980) is a useful analysis tool to obtain an insight into the oversold and overbought levels in the market.
It monitors market movements profoundly and can be used across various other markets and timeframes.
CCI compares both current and historical average price to conclude the outcome. High readings, such as above 100, will indicate a strong trend on the upside.
Low readings, such as before 100, will indicate that the trend is strong on the downside. CCI can produce false signals as well, so a trader must have a clear vision of the particular signal.
CCI is an Unbounded Indicator because, unlike others, it can indefinitely glide higher or lowers down. A trader must confirm the price because there is a possibility of a reversal point.
What is Commodity Channel Index or CCI?
Developed in 1980 by Donald Lambert (a technical Analyst), the Commodity channel was initially designed to serve the trading community as a helpful analysis tool.
Thus, CCI is an effective way for traders to create a clear pattern of overbought and oversold phases in the market.
In addition to these phases, CCI also helps the trading community identify the ‘trend direction and strength of the stocks.’ It helps them to have an overview of the market and identify the emerging buy or sell opportunity.
That’s why it’s one of the most used indicators that comprehensively display the ‘buy and sell’ signal to the trader.
Over time, the effectiveness of CCI was started to be realized at a large scale. And not just traders, but across all markets or timeframes, this analysis tool became popular.
Few traders use CCI to get an idea about the dominant trend on a longer-term chart; on the other hand, few traders use CCI on a shorter-term chart to generate trade signals in some risky situations.
CCI is to satisfy the following conditions-
- In the “overbought” condition, 75% price movement is essential to stay between +100.
- In “oversold” condition, 75% of price movement is essential to stay between -100.
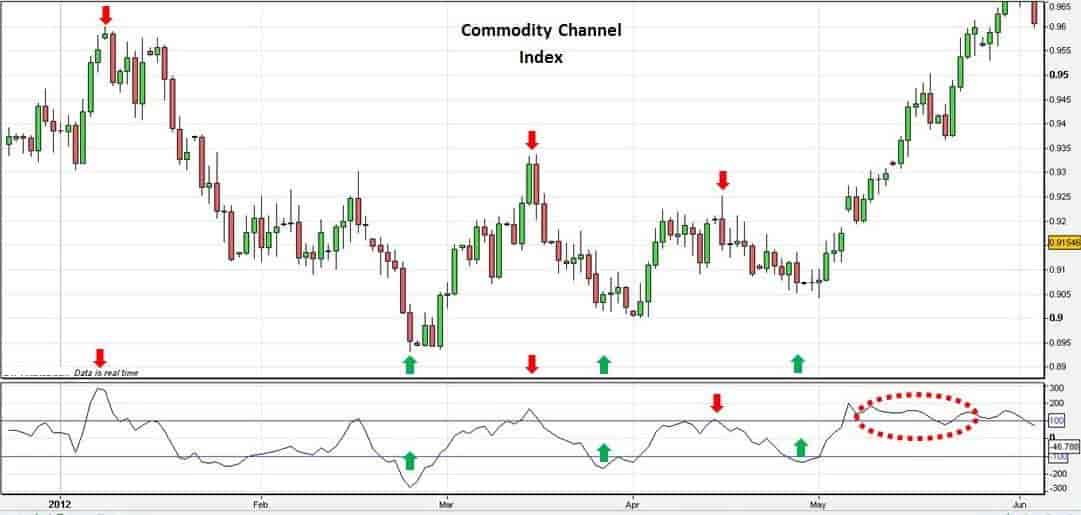
Let’s understand how a trader should use CCI to get a glimpse of potential buy and sell signals. Have a look at the example given below in the chart.
Open a Commodity Demat & Trading Account Now! – Fill up the Form
Understand CCI Indicator with an Example
Check out this example to understand how Commodity Channel Index works –
Potential Buy Signal
The CCI is below the oversold line (-100) and then crosses the oversold line above.
Potential Sell Signal
The CCI is crossing the overbought line (+100) and then below the overbought line.
This CCI chart indicates the possibilities of overbought and oversold conditions and provides valuable insight to the trader to find a buy or sell opportunity.
Interpretation
The Commodity Channel Index (CCI) values will be at its peak when the prices exceed the average level, and this signal will be pointing strength.
On the contrary, the Commodity Channel Index will be going down if the prices are dropping and going beneath the average level, and this signal indicates weakness.
The Commodity Channel Index (CCI) is often employed as either a leading or coincident indicator.
For instance, as a coincident indicator spike over +100, it indicates intense price action, which points out the initiation of an ‘uptrend.’ Plunges below-100 indicate poor price action and point out the initiation of a downtrend.
As a leading indicator, the analysts should search for over-sold or overbought situations because it’s likely to trigger a mean reversion.
Likewise, positive and negative variations can be seen to track sudden momentum swings and evaluate the trend reversals.
Commodity Channel Index is used as a Trend Indicator
The use of the CCI trend indicator can also show the analysts’ indication of the trend. For instance, if the trend has good momentum, the possibilities are high that rates will begin to increase or fall.
However, this indicates that analysts should wish that the price proceeds in the same direction.
Similarly, the next time whenever they want to see how big the trend pattern is, they will glance at CCI for a suggestion.
How to use CCI Trend Indicator?
Commodity Channel Index use in terms of a trend indicator is incredibly helpful when paired with some other trend indicators as well, for instance- like moving averages.
By following this method, an analyst gets assistance to pick the bottoms during the rally condition or the tops when there’s a decline. In a nutshell, using the CCI as a trend indicator, analysts or trader can fine-tune their entries effectively within the trend.
CCI is used to Spot Divergence
Like other oscillators, the Commodity Channel Index (CCI) indicator is often employed to track divergence.
The analyst can also weigh up the high or low prices to the Index values within this particular instance.
Typically, higher highs or lower lows (or vice versa) in prices must have a similar ‘value in the index.’ Still, if analysts find a discrepancy in the highs and lows, they can anticipate that the CCI divergence would result in the Price Correction.
Where divergence is observed, CCI generally coincides with a drop in momentum. And it’s the general fact that when momentum falls, the price is likely to go in the reverse direction.
How to use Commodity Channel Index Divergence Indicator?
The CCI may suggest price variations. If this happens, so it depicts an unwanted signal to the dealer that the price is highly probable to be reversed.
In some instances, a transition in the trend can also arise. That’s why a trader must be active for all time and keep evaluating the signals of ‘CCI divergence.’
Overbought / Oversold in CCI Indicator
When it comes to the identification of ‘Overbought and Oversold condition’ in the market with CCI or other similar oscillators, analysts often encounter problems.
You must bear one thing in mind that CCI is also identified as an Unbound oscillator.
In short, it doesn’t have any upside or downside limits as opposed to other oscillators. Thus, it sometimes creates a subjective assessment for the analysts.
However, when an indicator becomes overbought, the stock/securities are likely to move higher. On the contrary, when an indicator becomes oversold, the stock/securities are likely to move lower.
But both overbought and oversold conditions can vary because it’s based upon the Commodity Channel Index.
For instance, +/- 100 perhaps work in a trading range; still, extreme levels are essential to deal with this situation.
Similarly, +/-200 will be deemed a relatively harder level and is likely to be a ‘true extreme level’—however, the ‘volatility of the security’ influences the choice of both overbought and oversold levels.
Bullish / Bearish Divergences in CCI Indicator
Divergences indicate a possible reversal point when the directional momentum fails to confirm the price.
Bullish divergence happens as the actual security lowers lows, as well as the ‘CCI,’ represents a ‘higher-low; it merely indicates minimal downside momentum.
On the other hand, the bearish divergence is created when the stock/security indicates a higher high, as well as the CCI reports a lower-high. It reveals less momentum on the upside.
An analyst shouldn’t take actions in excitement if divergence is representing a profitable reversal indicator; remember that the divergence can also be inaccurate during a strong trend.
Although, a strong uptrend sometimes reveals various bearish divergences before the top eventually pops up. On the flip side, there are also bullish divergences in the long downtrends.
Confirmation is an essential indicator providing a clear insight into the divergences. However, divergences represent a shift in direction that is likely to trigger a trend reversal.
That’s why an analyst is required to set a confirmation point for the price chart or Commodity Channel Index.
Limitations of Commodity Channel Index
Every indicator will fail to provide you with the desired outcomes if you aren’t fully following the right course of action.
The metrics that ‘statistically turn price and volume data’ are likely to lag behind the price itself and expected to give ample previous data, enclosed already in it.
In simple words, the CCI should be employed carefully to initiate other sorts of technical analysis.
Although the CCI often advises you that perhaps the asset’s price is out of line as compared to the historical average price, there may still be rational underlying factors summarizing this case.
Moreover, the ‘valuations of such stocks’ – and often indexes or the whole types of assets experience speedy and acceptable adjustments.
If we talk about the price reversal indicator, the CCI can view this shift as an unnecessary step. Yet asset prices don’t necessarily mean a reversal point.
For instance, if the market members start anticipating that the market is moving in a particular direction, this will generate a pattern.
Conclusion – Commodity Channel Index
So, this was all about the CCI Indicator, how this powerful tool helps traders despite a few shortcomings.
While most of the traits of Commodity Channel Index Indicator are somewhat similar if we compared with other oscillators. Still, it’s a unique way to evaluate the price momentum.
Ultimately, having a great understanding of the CCI trading strategy can genuinely help the traders capture success in trading.
But make sure that, like other indicators, CCI also has few underlying risks, so you need to consider every point carefully.
Open a Commodity Demat & Trading Account Now! – Fill up the Form
Most Read Articles