Average Directional Index or ADX – Meaning, Calculation, Concepts & more
Last Updated Date: Aug 30, 2023Before we dig down to learn more about the Average Directional Index or ADX as a technical indicator, you need to know about trading in trend.
Ideally, when you choose to trade in a strong trend, it will minimize risk and also enhances the profit potential.
The average direction index is mainly used to check when the prices tend to trend robustly. In the majority of the cases, it is the eventual trend indicator.
Lastly, you never know, maybe the trend would be your acquaintance but surely it will help you understand who your real friend is.
Under this guide, we will cover everything about ADX as a technical trend indicator.
What is Average Directional Index or ADX?
The famed technical analyst Welles Wilder had introduced the ADX indicator. The ADX indicator is not similar to RSI as it doesn’t tell whether the trend is bearish or bullish; instead, it determines the strength of the ongoing trend.
Ideally, the ADX or average directional movement index is determined to show either contraction or expansion of the stock or security over a specific period.
Generally, ADX is calculated 14 time periods, but experts tend to commonly use this indicator with both low, including seven, and high, including 30 periods.
More tropical settings are most likely to make the ADX to respond instantly to the price movement, but the main issue here is it might also give out false signals.
On the other hand, the best part about higher settings is that it reduces fake alerts and makes the ADX an indicator of a more lagging one.
The indicator makes the trader aware when the market is trending, and it also removes the anti-trends that helps the trader to understand chasing indicators from regular whipsaws.
Open Demat Account in 10 Min & Start Trading Now!
How to Calculate Average Directional Index or ADX?
The formula for calculating ADX is:
DI = (ATR/ Smoothed +DM) × 100
(-) DI = (ATR Smoothed -DM) × 100
DX = (∣+DI+-DI∣∣+DI−-DI∣) × 100
ADX = 14 (Prior ADX×13) + Current ADX/14
Here, DM= Directional movement, which is calculated as Current high – previous high. (–) DM or negative directional movement is the previous low – current low. Lastly, ADR refers to the average true range.
The backbone of the directional movement system is formed by positive and negative directional movement.
Welles Winder, the one who determined the indicator, calculated the directional movement by correlating the difference between their highs and lows, respectively.
The smoothed averages of these differences help in calculating the plus and minus directional indicators. By using the smoothed averages, you can also determine trend direction over a specific period.
Interpretation of DI
ADX max tends to offer information only about the trend’s strength, and in general, it is supported with a directional index that is + and – DI for understanding the movement.
The interpretation will include:
- It is an uptrend provided +DI is more than –DI.
- It is a downtrend provided –DI is more than +DI.
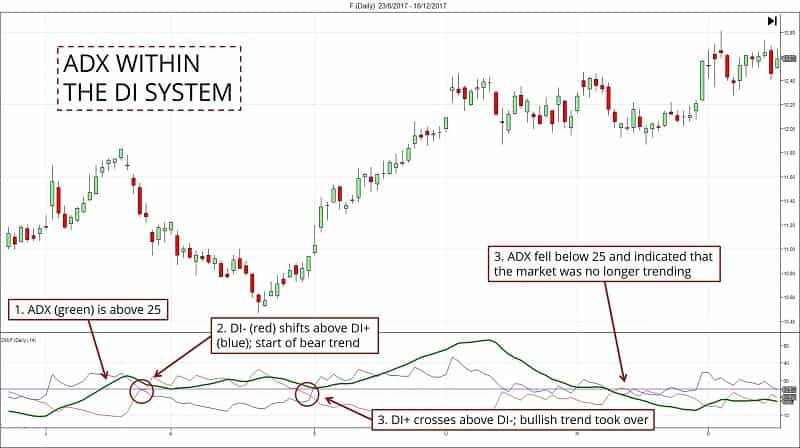
- When +DI crosses over –DI, it signals to a reversal of the bullish trend.
- When –DI crosses over +DI, it signals to a reversal of the bearish trend.
Understanding ADX
- ADX indicator mainly depends upon the price; when the price rises, the ADX indicator also increases, and then you can call it a bullish trend.
- When the price falls down, the ADX indicator is UP; then, you can call it a bullish trend.
- It is a trading zone when the value of ADX hits below 20, which basically means it is a non -trending market.
All you need to know about the ADX Strength Scale
- Stock is most likely to be in trading range if ADX ranges somewhere between 0 and 20. It is just cutting around the sideways, so all you can do is avoid these for trend trading.
- You can start trend trading once the ADX hits above 20. When ADX is right above 20, then big moves are most likely to take place.
Important Concepts on Average Directional Index
Volatility and volume go hand in hand – One of the significant reasons why ADX is an essential tool because it most likely focuses on the strength and trend of security.
Additionally, you need to know that if the security is exceptionally volatile, then it might not go as per the ADX reading always.
Stocks that get along with ADX usually have higher volume but don’t feature extreme volatility.
Divergence – When it comes to divergence, then one thing you need to know that it isn’t the same as other indicators mainly because it doesn’t evaluate the change in account.
The trend is only intact if the value hits more than 20.
Trading the trend – It is most probably the buy signal if the price is rising UP and along with the ADX indicator is also increasing.
Above all, the value should be beyond 20, and +DI should be greater than –DI. On the other hand, it is a sell signal if the price is falling down, and besides, the ADX indicator is also rising, and the value is beyond 20.
But under this signal, the –DI should be less than +DI.
Understand the trading with ranges – Price is most likely to enter consolidation if the ADX hits below 20. Price only trends when ADX hits above 20.
It is a sign of accumulation when the ADX is low. You can quickly identify the price patterns when ADX falls below 20 and price ranges enter into range conditions.
Limitations of Average Directional Index or ADX
- ADX ideally takes time to react or, in general, a lag indicator as it mainly depends on moving averages.
- ADX doesn’t offer signals for less volatile or gradually moving securities.
- Often, the crossovers of +DI and –DI can take place, which leads to faux indications.
- ADX cannot be used in dissolution like other indicators, so it has to be used in support of other indicators or oscillators.
Conclusion: Average Directional Index
A group of directional movement indicators including ADX, -DI, and +DI form a trading system which was given by Welles Wilder.
Whether the price is rising or falling, ADX registers the trend strength mainly because it is non-directional.
The ADX measures the uptrend strength when +DMI is more than –DMI, and when the prices fall down, then –DMI is more than +DMI, then it is downtrend strength.
Open Demat Account in 10 Min & Start Trading Now!
Most Read Articles