Volume Price Trend or VPT – How it works, Calculation, Trend Table & more
Last Updated Date: Nov 16, 2022Know everything about Volume Price Trend or VPT Indicator here.
If we want to trade in the stock market, then you need to know that there are a plethora of indicators available, but we stick to what’s essential.
You need to understand that the volume price trend is one of the trusted and leading trade indicators.
If you are someone looking forward to one of the best volume trading strategies, then you can surely not go wrong with Volume Price Trend or VPT Indicator.
The majority of the well-experienced traders holding an array of skills tend to use volume to determine the investor’s interest in the market.
The sensing accumulation of traders is mainly used in both uptrend and downtrend momentum.
About Volume Price Trend Indicator
The specific insights that you avail along the Volume Price Trend or Price Volume Trend Indicator offer you the ability to trade with exceptional strength.
It is said that the compelling indicator performs at least 300 calculations on each bar and also offers the required nuts and bolts of both tools and technology.
Ideally, the volume by price indicator is plotted horizontally on a chart. It portrays the different share volumes during a particular price level.
On the y-axis, the histograms are plotted, and they mainly help traders to use it as a forecast in the areas of both resistance and support.
The chart is most likely to use the closing price for determining the price indication.
Open Demat Account in 10 Min & Start Trading Now!
How Volume Price Trend or VPT Indicator works?
If you want to become a professional trader without any restrictions, then the volume price trend is your best bet as you get the freedom to become a trader without any stress.
Often the volume price trend is also known as the price volume trend. To form the hybrid trading indicator featuring two variables, the volume price indicator tends to mix price and volume.
The main idea of creating the indicator is to enhance the volume of the market by the change in the percentage in the price over a given period of time.
The value of the indicator mainly declines when the price falls, and it is due to the pessimistic value. The value of the indicator is most likely to increase with the increase in the price.
Ideally, the volume of the price trend indicator is similar to the on-balance volume indicator.
The only difference between the two indicators is that the indicator is most likely to rise or fall with the on-balance volume indicator depending on the price that easily made some high or low.
The extent of the move is not included in the indicator calculation. While on the other hand, the volume price trend indicator moves mainly depend on how big or small the shift was made with regards to price.
One of the most common promises made behind the volume price trend indicator is that the indicator has to be in the same direction as the price.
The market is said to be going in a reversal trend when the price moves with low volume.
Learn everything about Technical Analysis & make for money in stock market
How to Calculate the Volume Price Trend?
Firstly, you need to know that VPT is not similar to price volume indicators.
It is mainly due to the reason that the indicator takes into account the increase or decrease in percentage with regards to price.
It doesn’t only add or subtract the volume depending on the fact that the price is more as compared to yesterday’s price.
The formula for calculating for the volume price trend:
Previous VPT + Volume x (Today’s Closing Price – Previous Closing Price) / Previous Closing Price
The main idea behind calculating the volume price trend indicator is to multiply the stock’s market value by the percentage change in its price.
The value of the indicator will also decrease if the price of the stock drops. The value of the indicator will enhance if the price again rises.
Generally, VPT is calculated on an everyday basis, but you also need to know that you can calculate VPT over any duration with the volume data available.
How do you interpret the VPT Indicator?
When traders take a look at the volume price trend, they generally tend to look for divergences.
You can term it as divergence when the price of any security moves in the indicator’s opposite direction. Additionally, it also suggests that there might be a change in the price’s direction.
For instance, you can say that the price movement is weak if the volume remains static, but the price increases, and also the chances for reversal are considerably high.
If you are into trading and also know how to use the indicator, then you will surely not dig into long trades estimating the market will rise up any further.
Some of the interpretations of the Volume price trend are:
- The price will trend upward if both the price and volume increase simultaneously.
- Price will trend downward if both the price and volume decrease simultaneously.
- The trend is most likely to be known as divergence if the increase in price is supported by a fall in the flat volume trend. Additionally, it can be said that it is a weak trend, and it won’t hold for a longer duration.
How to trade using Volume Price Trend?
Mainly, under technical analysis, the volume price trend is used for long timeframes as it is aggregative in nature.
It is challenging to use the indicator on a short term, and intraday basis as the changes can be limited.
The Volume Price Trend Table
| Sl No | Price | Volume | What is the expectation? |
| 1 | Increases | Increases | Bullish |
| 2 | Increases | Decreases | Caution – weak hands buying |
| 3 | Decreases | Increases | Bearish |
| 4 | Decreases | Decreases | Caution – weak hands selling |
Traders may move the prices at different times before the trade ends. It can be relevant or not, depends on the traders.
It is the reason why many traders observe fast move on world events that have no bearing. And unexpectedly, the market moves lower on good news and higher on bad news.
It is because of the oversee traders who are licensed insiders and tend to sit in middle of the market to look at both sides. They ensure the balance between supply and demand at a particular time.
During this, the only tool to guide back and support the stability in the market is the volume of shares that traders hold.
Volumes are equally valuable irrespective of the market changes. It helps recognize the buying shares interest updates daily.
The consistency and ups and downs of any share are recorded and reported from minutes to hours. The volume information may seem a little unimportant from the present perspective.
But, it is the only source to keep a record that maintains the behavior of shares in different trends. The details include price variations.
It would be the same whether it is increasing or decreasing.
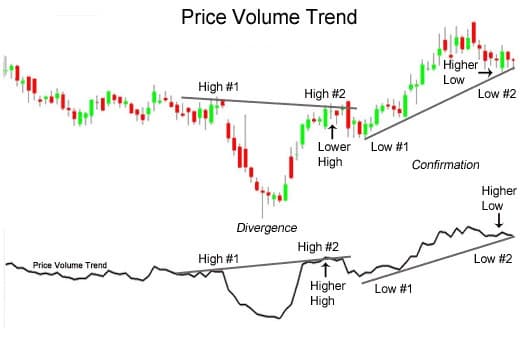
Volume Price Trend – Chart Pattern
It means that if in a candlesticks pattern, there is support near the stop loss, it makes the stock likable for buying.
But if there is high volume the next day on the blue candle that indicates a bullish engulfing pattern along with support on its low, it means that there is a definite increase in the volume and price, making it market ready for institutional participants.
Therefore, irrespective of the candlesticks trading strategy that traders apply, there are no downfalls in the application of volumes.
It provides a better view of the market in terms of highs and lows concerning the price and money and efficiency of buying and selling.
The checklist that traders should anyways verify include
- Presence of a candlestick pattern in the stock is necessary.
- The confirmation of the security and risk team to carry on the trade.
- The importance of volumes to confirm the trade.
Volume Price Trend (VPT) – Conclusion
The volume price trend fuses both volume and price to make an aggregative running indicator. The critical element in calculating the volume price trend with regards to price is divergence.
If the price doesn’t match with the constant increase in the Volume price trend, then traders will see it as a shallow move.
Thus, the current trend in the market is mainly confirmed when the price matches the volume price trend. Hence, this indicator is fantastic to use for the long term.
Open Demat Account in 10 Min & Start Trading Now!
Most Read Articles