Best Swing Trading Indicators – Find the list of Top Swing Trading Signals 2024
Last Updated Date: Jan 02, 2024We wish to walk you through the notable Swing Trading Indicators or Signals, if you wish to transform into a successful Swing Trader.
Swing trading is a short-term securities trading strategy. It focuses on booking small profits over short periods by identifying and capitalizing on price swings in the market.
The market typically goes through several price ups and downs and can thus provide a significant profit-making opportunity to swing traders.
In this article, we will look at what aids swing traders use to identify these opportunities and how they can be effectively interpreted.
What are Swing Trading Indicators and Why are they Important?
To understand the importance of swing trading indicators, we need to understand how swing trading works.
Swing trading works on the basic premise that the behavior of a stock’s price does not always move in a singular direction.
It will in fact oscillate between highs and lows – i.e.: through bullish and bearish phases. The spread of this price oscillation is what creates the opportunity for profitable swing trading.
This is the way a swing trader seeks to capitalize on market swings:
Downswing from a High
This is a situation in which prices reverse downwards after reaching a high.
In such a trend, a swing trader will look to short sell the stock at its high with an intention to buy it later when the price reverses downwards.
An Upswing from a low
This is when prices jump up after touching the trend’s low. Here a swing trader will seek to buy a stock at its low with the intention to sell at a higher price when the prices reverse and begin to rise.
 But how will a swing trader identify when the stocks have touched their highs or lows? It is here that swing trading indicators come in.
Swing trading indicators are tools that help identify the highs and lows within the price trends so as to generate appropriate buy or sell signals.
The intention is to generate signals in such a way that results in a profit for the swing trader when the trade is squared off.
Apart from identifying highs and lows, swing trade indicators are also useful for identifying shifts in the price trends – or what is called ‘breakouts.
When the stock’s prices significantly and consistently breach the highs or lows of a set trend, it results in the creation of a new price trend.
Without the application of swing trading indicators, it would be difficult to identify price trends and generate profitable buy and sell signals.
Open Demat Account Now! – Zero Brokerage on Delivery
Swing Trading Indicator Categories
Here are few categories of Swing Trading Indicators or Signals
Trend indicators
Trend indicators are those which reflect the price trajectory of the stock and help in determining the price trend.
Momentum Indicators
Momentum indicators point towards the veracity of price trends. These help to identify if a retracement in the trend is likely.
Volume Indicators
These indicators indicate the quantum of trade of a particular stock within its price trend.
By determining the number of active sellers and buyers for a stock, volume indicators can help gauge the chances of profitably squaring off a swing trade.
Most trade indicators fit into one of these broad categories.
Best Swing Trading Indicators or Top Swing Trading Signals
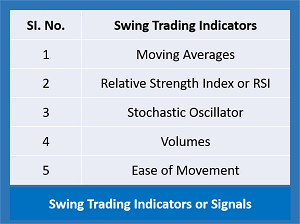
Here are the list of Best Swing Trading Indicators or Signals –
| SI. No. | Swing Trading Indicators |
| 1 | Moving Averages |
| 2 | Relative Strength Index or RSI |
| 3 | Stochastic Oscillator |
| 4 | Volumes |
| 5 | Ease of Movement |
More Information on Swing Trading & Styles of Trading
| Swing Trading | Swing Charting | Swing Trading Strategies |
| Styles Of Trading | Swing Trading in Options | Swing Trading for Beginners |
| Momentum Trading | Position Trading | Pullback Trading |
Moving Averages – Best Swing Trading Indicator
Moving averages are an example of trend indicators. There are primarily two types – simple moving average (SMA) and the exponential moving average (EMA).
These plot price lines by joining averages of stock prices over a specified time period. SMAs give equal weightage to all prices within the period.
EMAs are akin to a weighted average which gives more preference to more recent price movements. Swing traders generally use both short term and long-term MAs.
Short term MAs can be for 5-to-50 time period whereas long term MAs can be for more than 50-100time period.
Moving averages can indicate the tenability of the trend – the basis of how the trend is placed from the moving average lines.
One way of interpreting moving averages is to watch for when they converge. The price chart plots the short-term and long-term moving average lines.
If the short-term MA passes the long-term MA from below, it can indicate a rising price trend and vice versa.
Relative Strength Index (RSI) – Top Swing Trading Signal
RSI is a momentum indicator. It is one of the most popular indicators that swing traders use. RSI examines the relationship between buyer demand and the selling demand.
It gauges if a stock is overbought or oversold. This can in turn hint at a likely retracement in the price of the stock to balance these demands.
RSI charts out a price oscillator which plots the stock’s closes over a set period. This is represented within a range of 1-100.
Any point above 70 is considered to be a level of the stock being overbought, indicating a possible downward price reversal.
On the other hand, a point below 30 is considered to be the level of the stock being oversold.
This indicates a possible upward price reversal. A stable RSI can indicate a possible continuing price trend with no immediate price reversal on the horizon.
Related Articles on Share Market Trading & Investing
Stochastic Oscillator – Best Swing Trading Signals
A stochastic oscillator is a variant of the RSI. It also considers a price oscillator. It however encompasses two price lines – one being the price oscillator, the other being a short period moving average.
This goes one step ahead of the RSI and relies on when these two lines cross each other to indicate an imminent price reversal.
Volumes – Top Swing Trading Indicators
Volumes as an indicator provide insight into the quantum of trades taking place within a particular price trend.
Price trends attracting a high volume of sellers and buyers can point towards a strong price trend and vice versa.
A substantial trend is one that has a reasonable amount of trade volume. Thus, the volume indicators can help gauge the veracity of a specific price trend.
Articles Related to Investment Strategies & Indicators
Ease of Movement – Best Swing Trading Technical Tools
This indicator looks at the momentum in the price trend and corresponding volumes of trade simultaneously. The benchmark level for this indicator is set at zero.
If the ease of movement indicator crosses the benchmark in an upward direction it can indicate that prices are moving upwards with relative ease and can continue to do so.
The same will indicate the ease of falling prices in case the indicator begins falling below zero.
If prices are rising along with a rising EOM but volumes do not rise it could indicate that the bullish trend has low strength and that a downward price reversal is likely.
While indicators assist swing traders, they can be more efficiently interpreted when used in conjunction with key technical analysis techniques and tools such as support and resistance levels, Bollinger bands, etc.
Conclusion – Swing Trading Indicators
While most swing traders use indicators to book profitable swing trades, they do suffer from certain limitations, they do suffer from certain limitations.
Keep these in mind before completely relying on them. Swing trading indicators are at the end of the day indications towards price trends and cannot guarantee price movements or reversals.
They can thus not guarantee that the swing trader will book a profit. Investor and trader sentiment often affects market movements.
Swing trading indicators may not always capture this. It is thus imperative that swing traders’ practice and gain experience which they can apply in conjunction with the indicators.
Swing traders should also ensure to set up the triggering of stop loss signals by these indicators to keep their potential losses within acceptable limits.
Open Demat Account Now! – Zero Brokerage on Delivery
Most Read Articles