Swing Charting – Concept, Workings, Usage, Trend Reversal & more
Last Updated Date: Nov 17, 2022If you are a trader, then you are surely going to find this page on Swing Charting interesting.
With the plethora of options available in the market, almost all the new traders fall into the paralysis of the analysis.
You must be thinking, where you can start, like with the best charts or with the swing trading basics. Irrespective of the type of asset, there are a plethora of charts for swing trading.
Swing trading is ideally about taking on a place for a specific time period. Above all, there is no real-time limit for trade as such.
There might be an investment option for you once you get past the benchmark.
About Swing Trading
Swing trading has become quite famous among traders and investors, thanks to stocks that exhibit strong trends.
Above all, it is one of the prevailing common techniques that traders use when it comes to understanding a P.
Swing charts are quite useful for technical analysis and some of the reasons why it is famous are:
- No doubt, swing charts just show the trends, but they are quite unique to help the traders to locate the trends. Above all, trends are the basic means of profiting in almost all the markets.
- Swing charts don’t exhibit much noise in the market. It aids you in accurately applying other forms of insensitive technical analysis.
- Some of the other variations include techniques like Kagi charts and Gann-based swing charts. These charts offer some tricky ways to locate the trends. Often these techniques also provide an option of making several empirical changes to improve trend finding capabilities further.
Open Demat Account Now! – Zero Brokerage on Delivery
How does Swing Charts work?
Ideally, in the most basic form, swing charts feature price bars that represent the behavior of the price during a specific duration.
Probably almost all traders and investors know the bar charts as it is one of the common chart types. The vertical lines show the price range.
The left peg depicts the opening price, and the right peg depicts the closing price during the specific time period.
No doubt, there are a plethora of ways to construct a swing chart featuring highs and lows. But in this guide, we shall focus on a prominent chart known as the Gann swing charting method.
Swing Charting Turning Points
Some of the primary turning points featuring under this charting method include:
- Inside day: you can see it in black color and it shows Lower high and high low.
- Outside day: you can see it in blue color and it shows Higher high and lower low.
- Up day: You can see it in green color and it shows Higher high and higher low.
- Down day: it depicts red color on chart and shows Lower high and lower low.
By using the charting method, you can learn about the entry and exits of various trends using the various turning points. If you want to build the swing chart, then you must remove the time as a factor.
Ideally, you need to only focus on the action of the price. You just need to know about finding two points, including down day which follows an up day and up day follows the down day.
Basically, these points show when a trend starts or ends, including the time to enter or exit the swing trade. After marking these points, you can finally construct the swing chart.
Firstly, to construct the swing trade chart, you need to remove the time element by moving the elements together at the same intervals. At the same time, you will maintain the order.
Lastly, you need to join all the points if you want to complete the chart. Hence, you can see the time factor is no more dominating, so you can easily see the price trends.
More Information on Stock Market Trading Strategies & Indicators
How to Use Swing Charting?
Here is the easy process to use Swing Charting –
View overall Trend
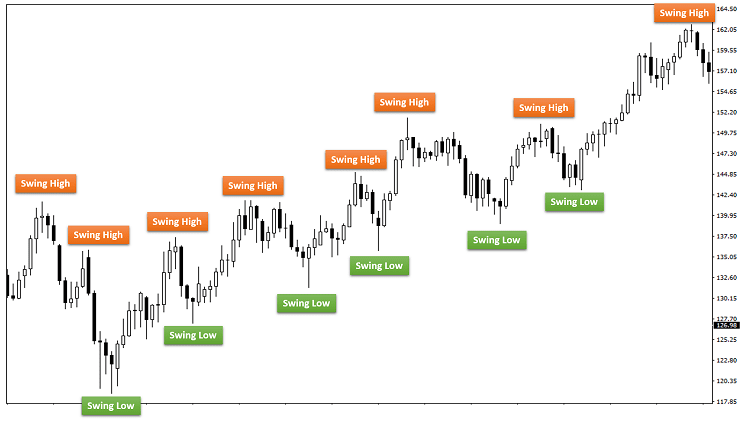
You can easily view the overall trend of the security or the market. Additionally, you can quickly discern the pattern by looking for highs and lows progressively. They form a stair-like pattern.
Swing Charts helps to position Stop Loss
The charts help you to position the stop loss and take profit points easily. You can take the previous highs as take profit points.
On the other hand, you can use previous step bottoms throughout the trend as the moving stop loss element.
Swing Charting helps in Applying Indicators
Charts also help in applying the techniques of technical analysis that are not time-sensitive. For instance, you can use Fibonacci levels or Elliott Waves.
These can help you understand where the prices head.
Create Price Channels
Create price channels using the charts. You can develop these channels by joining the consecutive lows and highs.
The best part about these channels is they can help you in predicting the prices by placing moving take profit and stop-loss points.
You can use candlesticks and oscillators also independently or in combination. Additionally, you can use it to highlight the potential short term trading opportunities.
Primarily, the swing trader uses the swing charts so they can take advantage of short term price moves.
If you want to use the trend, then you need to determine the direction and strength of the trend accurately.
Related Articles On Share Market Trading & Investment
Reversal Trend in Swing Charting
You can look for short-term reversals at a price to focus on potential price moves in that direction if you are into swing trading.
Firstly, you need to look for the perfect reversal trend for a turnaround, and you can either do it through candlesticks or oscillators.
Ideally, the candlestick reversals feature indecision candles that depict a substantial shift in the sentiments. On the other hand, through divergence, oscillators highlight divergence.
Swing Charting – Conclusion
The candlestick charts and oscillators mainly aid the swinging trade strategies, which help in identifying the potential trades.
When oscillators begin to diverge from the current trend, they can track momentum.
Candlesticks, including spinning top and engulfing patterns, can help in confirming bullish or bearish sentiments swing traders can benefit from.
Basically, the swing charts help to view the trends easily by eradicating market noise and time factors.
You can utilize this chart along with different forms of technical analysis to gain better, accurate predictions.
The swing markets can surely help you if the trend is your friend. The technical experts also use charting techniques to learn about the exit and entry points in the future.
Lastly, you rely on this charting technique to get information about the market.
Open Demat Account Now! – Zero Brokerage on Delivery
Articles Related to Share Market Education & Trading Styles
| Styles Of Trading | Momentum Trading | Active vs Passive Investing |
| Position Traders | Position Trading | Swing Trading for Beginners |
| Swing Trading | Pullback Trading | What is Scalping? |
Most Read Articles