Value at Risk or VaR – Concept, Example, Calculation, Benefits & more
Last Updated Date: Aug 30, 2023Know everything about VaR or Value at Risk here.
Before putting entire savings into the investments, the first thing that strikes in any investor’s mind is ‘risk.’ It’s highly linked with the fear of losing money on the investment.
Investors question themselves, what’s the limit of loss that I can bear with this investment?
However, the question is usual among investors, mainly among those who have put entire money into a risky asset or planning to invest due to the high returns.
But which thing can help an investor feel confident about his investments? Perhaps, Value at Risk or VaR can be the best answer for it.
So let’s dive into the article outlining the practice used to compute VaR or Value at Risk. But What is it? How it’s helpful? Know it right over here.
What is Value at Risk or VaR?
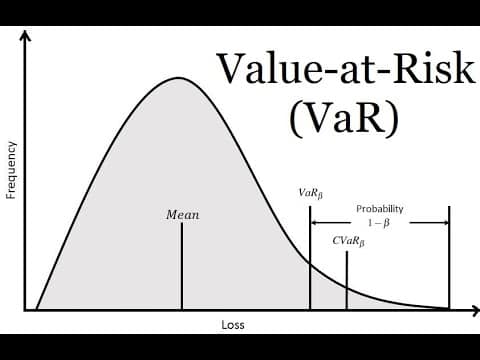
Value at risk, also speak out as VaR, is a quite useful method among investors to count risk. VaR count up the chances of loss generating from an investment.
Such as how much an investor is going to incur loss during a certain period. It provides a broad chart to the analysts.
VaR provides investors with an idea of the risk level, cropping up with a particular investment.
The method helps investors come across the potential gains from the investments by playing at the potential risk value linked with it.
Ultimately, you get a clear insight into whether the gain from this investment is worth the potential loss or not.
You can count up the Value at Risk for one asset or multiple assets portfolio. It’ll derive the ideal information.
Open Demat Account in 10 Min & Start Trading Now!
Example of Value at Risk or VaR
On a particular position, the Value at Risk is tally by taking the potential loss amount into account.
Alongside the identification of loss chances and a particular ‘period’ during which the loss is likely to occur, also viewed.

VaR is then put forward in percentage form within that specific time frame.
For instance, if we talk in the mathematical language, so you can call it in the manner that an asset has a 3% one-week VaR of 2%.
However, this implies a 3% probability that an asset is likely to decline by 2% within one week.
Methods used for Calculating VaR
Here are the few methods used for calculating Value at Risk.
Historical Method
The historical method is one of the quick ways that most of the traders in calculating Value at Risk or VaR.
In the process, on the base of ‘last 250 days market data,’ done through a calculation, ‘risk factor’ on each day is point out.
The derived term follows ‘percentage’ form. Each percentage change is then gauged alongside the value of the current market.
It showcases the 250 scenarios that are going to impact the future value. For every scenario, the investor uses full or non-linear pricing models for the calculation of the portfolio.
Though, if there is any worst day, it’ll come into the 99% VaR category.
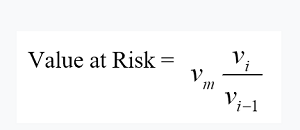
VaR Historical Method Formula –

Here:
Vi refers to the number of variables on a day
m refers to the number of days (From which historical data is taken)
Parametric Method
The Parametric Method, also identified as the variance-covariance method, follows a normal distribution across returns.
In this method, the investor uses two significant factors – the standard deviation and expected return.
Though, this method has viewed best among investors for risk gauging issues.
For instance,- it refers to those problems where an investor is familiar with the distributions, and the estimated value is also reliable.
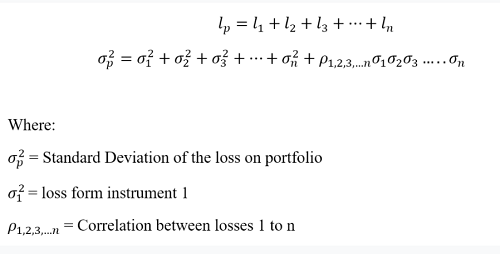
Let’s have a look at the formula below related to this method, where “l” refers to loss and “p” refers to a portfolio with “n” referring to the number of instruments.
VaR Parametric Method Formula –

Monte Carlo Method
Another mostly used method is Monte Carlo Method. Under this method, the VaR (Value at Risk) counts up through a random series of scenarios.
Though, this series is set up by the investor for future rates. The investor will be making it using non-linear pricing models that provide the estimation of each scenario’s change in value.
Subsequently, then calculating the Value of Risk as per the worst losses. However, this method is appropriate for an extensive range of problems related to risk measurements.
Most notably, it is when you have to deal with complicated factors.
Know everything about Risk Management here
Marginal Value at Risk or MVaR
The Marginal Value at Risk (MVaR) method is indeed the amount of additional risk. This amount is added after an investor puts a new investment in the portfolio.
MVaR helps fund managers grab the information related to the portfolio change, which is likely to happen because of the addition or subtraction of a particular investment.
The investment may have a high VaR. On the other hand, if the investment points out a negative relation with the portfolio, you can view it as a sign of a much lower risk amount to the portfolio.
Even, it will be lower than a standalone risk.
Incremental Value at Risk
Incremental VaR is the sum of complexity. This complexity is later subtracted or added from the portfolio, based on the investor, whether he wants to buy or sell an investment.
The calculation of Incremental VaR is followed by Standard Deviation, including return rate and the portfolio share.
Conditional Value at Risk (CVaR)
Conditional Value at Risk refers to an expected shortfall, tail VaR, or average value at risk, which implies excess loss or shortfall.
Analysts also denote CVaR as an extension of Value at Risk (VaR). CVaR helps in the calculation of the average of losses, which typically occurs beyond the VaR point within a distribution.
It’s always assumed much better if the CVaR is smaller.
Advantages and Disadvantages of Value at Risk or VaR
Here are the various pros & cons –
Benefits of Value at Risk
When it comes to the list of advantages of VaR, it’s vast, and the primary reason is the easy-to-understand structure of the metric, making it the instant tool for market analysis.
Similarly, it becomes the primary reason why investors or firms use VaR metrics extensively because it provides them with a comprehensive insight into the potential losses.
Also, traders bring metrics into action. It helps them in controlling their market exposure. However, in most instances, market volatility has also viewed as a traditional risk measure by traders.
Still, this isn’t assumed useful. This is due to the market volatility can trigger numerous opportunities that tend to go for a long or short term.
On the contrary, VaR specifically spots the odds of losing money. It can also act as a helpful guide in creating a strategy for risk management.
Disadvantages of Value at Risk
The lack of a standardized process follows the significant cons of VaR. It lacks the potential for gathering data required to assess the Value at Risk.
It’s pointing out that the different VaR methods, in most instances, can deliver different results.
Therefore, it’s always essential to understand that the VaR can unnecessarily show the probabilities of loss.
The obtained information sometimes misguides an individual and possible that the actual risk is bigger than the Value at Risk figure.
That’s why traders should use VaR in small part alongside using an effective risk management strategy.
Conclusion – Value at Risk or VAR
Value at Risk or VaR provides investors with an optimal insight into the maximum expected loss on a particular investment that he or she is going to bear over time.
If there’s a worst-case scenario, the VaR estimates everything. In the article, we’ve explored the methods to calculate VaR.
All these methods are useful; still, you’ll have to consider the time frame that each method follows.
Open Demat Account in 10 Min & Start Trading Now!
Most Read Articles
