Financial Ratios – Most important concept in Fundamental Analysis
Last Updated Date: Nov 17, 2022Know everything about Financial Ratios, its Analysis & also its importance in Fundamental Analysis here.
Financial Ratios is the most important pillar in Fundamental Analysis, lets have a detailed understanding of the same in this article.
About Financial Ratios & its Analysis
Financial Ratios are the best way to analyze and interpret financial statements. Analysts use these ratios to draw conclusions related to the overall well-being of the company.
Benjamin Graham, who is known as the father of fundamental analysis, said that the best way to analyze a company’s financial statements is to derive conclusions based on financial ratios.
The significant advantage of using ratios is that, just by looking at a number, one can compare the performance with previous years and also with similar companies in the industry. Thus, financial ratios make fundamental analysis an easy process.
However, the point to be noted here is that, just by looking at a ratio of one year, one cannot conclude anything meaningful.
To get substantial information, it is necessary to compare that result with previous years. This helps the analyst understand the trend.
Another important consideration is that these ratios are calculated based on financial statements. Different companies have different accounting policies.
For example, while one company might use a straight-line method for depreciation calculation, the other can use the written down value method.
The investor must keep this in mind while comparing the financial statements and ratios of the companies.
Open a Demat Account in 10 Min & Start Trading Now!
Types of Financial Ratios
Before you know about how financial ratio analysis is done, lets understand various types of ratios first.
In order to analyze different business aspects like profitability, operational efficiency, etc., different kinds of financial ratios are put to use.
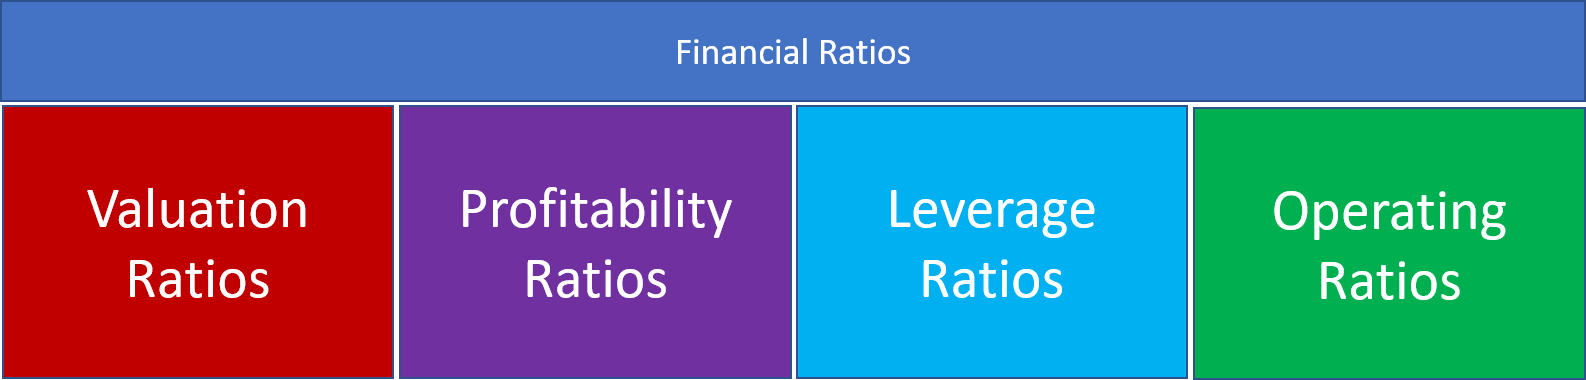
Based on their use, the financial ratios can be broadly classified as:
- Valuation ratios
- Profitability ratios
- Leverage ratios
- Operating ratios
We will now understand each category in detail.
Valuation Ratios
In a business sense, valuation refers to the price one would pay to acquire the business.
The valuation ratios help the investor compare the stock prices with the benefits of owning it. In simple words, these ratios tell if the stock is worth the price you wish to pay for it or not.
Many times, some businesses which would not sound exciting to you would have better valuation than those which would look exciting on front.
Valuation ratios should be compared to those of other companies in the same industry for better understanding.
The valuation ratios are calculated by comparing the share price of the company with a financial performance metric. Based on this, there are three main types of valuation ratios:
Price to Sales Ratio
This ratio compares the sales per share with the current market price of the share.
This ratio is better than the price to earnings ratio because earning shown in the books of accounts may vary based on the accounting policy used.
However, there is no way to modify the sales figures.
Price to sales ratio = Current market price of the share / Sales per share
For example,
Suppose, Total revenue = INR 3000 crore
Current market price of share = INR 500
Number of shares = 10 crore
Sales per share = 3000/10 = INR 300
This implies that, for every outstanding share, the company in consideration makes a sale of INR 300.
Therefore, price to sales ratio = 500/300 = 1.67 times
This means, for every sale done of INR 1, the stock is valued 1.67 times. Higher the P/S ratio, the higher is the valuation.
In order to conclude, it is essential to compare the P/S ratio of the company with similar companies in the industry. This will let the investor know if the stock is overvalued or not.
Price to Earnings Ratio:
This is one of the most popular and commonly used financial ratios. The P/E ratio is calculated using the stock’s current market price and the earnings per share.
This means the result of this ratio depicts the profitability of the company per share.
It also shows the demand for the company’s stock in the market, i.e., buyers’ willingness to pay for it. Thus, the higher the P/E ratio, the more expensive and valuable the stock is.
PE ratio = Current market price of the stock/ Earnings per share
Where, EPS is calculated by dividing total revenue with the total number of outstanding shares.
For example,
Suppose the total revenue of a company is INR 10,00,000
Total outstanding shares = 10,000
This means, EPS = 1000000/10000 = INR 10 per share
Continuing the same example as above,
The current market price of the share = INR 500
PE ratio = 500/10 = 50
This implies, for every unit of Profit this company generates, the investors are ready to pay 50 times.
Now, let us assume that the stock price increases to INR 600, while EPS remains constant.
Now, PE ratio = 600/10 = 60 times
This increase in PE ratio is because of the rise in the price of the share in the market. An increase in price shows an increase in the expectations of the company.
This clearly shows that the PE ratio is not a very reliable measure for considering long term investing. Few more points to substantiate this are:
- PE ratio takes into account earnings, which can easily be manipulated by changing accounting policies. So if, as an investor, you are considering the use of PE ratio, then you should take note of the policy changes the company does. If the changes are frequent, it is a red flag.
- The method of depreciation accounting should also be taken into account. By charging lower depreciation, high earnings are shown easily.
- Also, cash flows and sales figures should be considered while using the PE ratio. No conclusions can be drawn just by looking at the earnings.
Price to Book Value Ratio:
Book value refers to the amount left with a company after paying off all its debts and selling all its assets.
This is the amount which, when converted to a per-share basis, can be expected by the shareholder in the situation of liquidation.
Book value = (Share capital +Reserves)/Total number of outstanding shares
The revaluation reserve is not included in this calculation.
For example,
Suppose, share capital = INR 20 Crores
Total outstanding shares = 2 crore
Reserves (Excluding revaluation reserve) = INR 2 Crore
Hence, BV = (20+2)/2 = INR 11 per share
Now, the market price of the share = INR 110
So, the PB ratio = 110/11 = 10 times
This implies the share is currently trading at 10 times its book value. A higher PB ratio indicates that the share is overvalued and vice versa.
Learn everything about Fundamental Analysis Now!
Profitability Ratios
These ratios give the investor insight into the profit generation capacity of a company. Profitability is the index of competitiveness.
It also indicates expansion capacity in the future. Since the company pays dividends to its shareholders out of the profits, the profitability ratios are of immense importance.
The most important profitability ratios are:
Operating Profit Margin
This ratio is also known as the EBITDA margin (Earnings before interest tax depreciation and amortization). This financial ratio tells the investor about the operating efficiency of the company.
The ratio tells about the management’s capability of managing operating expenses, and hence, the profits.
In order to draw meaningful conclusions from the EBITDA margin, the investor needs to compare it with the competitor companies in the same industry.
EBITDA is calculated by subtracting the operating expenses from the operating revenues.
Here, operating revenue = Total revenue – Other income
Operating expenses = Total expenses – Depreciation and amortization -All finance costs
EBITDA margin / Operating profit margin = EBITDA / (Total revenue- Other income)
For example,
Total revenue = INR 500 crore
Other income = INR 50 crore
Therefore, Operating Revenue = INR 450 Crore
Total expenses = INR 200 crore
Finance costs = INR 10 crore
Depreciation and amortization = INR 5 crore
Therefore, Operating expenses = INR 185 crore
EBITDA = 450 – 185 = INR 265 crore
EBITDA margin = 265/450 = 58.8%
By looking at the EBITDA margin for 1 year, no firm conclusions should be drawn. If there is an upward trend or some consistency in EBITDA margins, it should be considered a green flag for investment.
Both EBITDA margin and its growth rate need to be compared with industry averages for better understanding.
Return on Equity:
The RoE tells the investor about the return shareholder earns for every unit of capital invested in a company.
Thus, the ratio signifies the company’s profit generation capacity for the shareholders. Therefore, the higher the return on equity, the better it is for the shareholders to invest in the company.
The ratio also shows the management’s ability to add to the shareholder’s wealth and efficiently manage the company.
The higher the RoE, lesser will be the need for the company to go for external funding. This makes the ratio very important from the perspective of the investor.
Return on equity is calculated as : (Net profit/Shareholder’s equity)*100
However, the major drawback of this ratio is that the RoE can be increased by taking a debt. This is understood using the following example:
Suppose a company has shareholder’s equity worth INR 100 crore
So, in order to balance the balance sheet, there have to be assets worth INR 100 crore
Suppose the profits generated are INR 50 crore
RoE in case of no debt = 50/100*100= 50%
Now suppose, instead of issuing equity, the company takes a loan of INR 25 crore.
The equity capital = INR 75 crore
In the balance sheet, total assets = total liabilities
In this case, RoE = 50/75*100 = 66.67%
Thus, the figure of RoE substantially increases. So, while drawing conclusions based on RoE, it is crucial to closely examine the debt component in the balance sheet.
Expansion and growth at the Cost of financial risk are not recommended.
Return on Capital Employed:
This financial ratio calculates the company’s profitability, taking into account the overall capital that has been used by them.
The overall capital includes all sources, i.e., both equity and debt. Also, both long term and short term sources are considered while calculating the RoCE.
ROCE = Profit before interest and taxes/ Overall capital employed
You can quickly get the values for the capital employed from the balance sheet of the company.
At the same time, the profit calculation can be done by taking figures from the statement of Profit and loss.
PAT Margin:
While calculating the PAT margin, the overall profitability is considered. All the expenses, including finance costs and depreciation, are subtracted from the total revenues to derive the Profit after-tax figure.
PAT Margin = PAT/ Total Revenues
Continuing the EBITDA example,
PAT = 500- 200 = INR 300 crore
PAT margin = 300/500 = 0.6 or 60%
Just by looking at the PAT margin for one year, the investment decision should not be made. A trend needs to be observed for better investing.
Return on the Asset:
The return on asset ratio calculates an entity’s ability to use the assets employed effectively. An entity that deploys non-productive assets is a big No for investing.
This is because the company drains its cash flows for buying assets; it does not use well.
RoA = [Net income + interest*(1-tax rate)] / Total Average Assets
The components in this formula can be explained as below:
- Interest*(1- Tax rate): The companies usually take assets by financing them. This creates an interest factor. The interest which is paid out to the debt givers also belongs to the shareholders only. Hence, while calculating assets’ efficiency in creating profits, this interest needs to be added back.
- Average total Assets: In order to avoid the confusion as to when the assets were bought during the year, an average of the total assets figure is considered for calculation.
This is calculated as (Assets in the beginning of FY+ Assets at the end of the FY)/2
Leverage Ratios
These ratios calculate the debt factor in the company’s overall capital. The leverage ratios, thereby, measure how long a company can sustain, keeping in mind the financial obligations it has.
They help an investor understand how much a company relies on debts to finance its growth.
The essential leverage ratios are:
Debt to Equity Ratio:
This is one of the simplest ratios and is most widely used. The debt-equity ratio compares the debt a company has in relation to the equity.
A Ratio of 1 shows that the company has equal components of both debt and equity in its capital structure.
A higher, i.e., greater than one D/E ratio, indicates higher financial obligations for the company. An investor needs to be careful in this case.
When equity is higher than debt, it is a relatively stable investment.
The debt-equity ratio is calculated as: Debt equity ratio = Total debt/ Total equity
The total debt includes both long term and short term borrowings of the company. Total equity includes reserves and surplus as well.
The figures for the total debt and equity can be easily found in the company’s balance sheet.
Debt to asset ratio:
This ratio conveys how much of the company’s assets are financed through debts. Higher the percentage of debt financing means higher is leverage and risk.
Suppose, in a company, if the debt to asset ratio is 30%, this means 70% of the assets are financed by the owners’ capital, which is a good sign.
The debt to asset ratio is calculated as:
D/A = Total debt/ Total assets
Interest coverage ratio:
Also known as the debt service ratio, this helps the investor understand how much the company is earning when compared to its financial obligations. A higher interest coverage ratio indicates good financial health.
It means that the company can quickly pay off its interest obligations and still have enough cash for operating expenses.
However, a low-interest coverage ratio signifies that the company can go to liquidation or bankruptcy if it does not modify its capital structure soon.
The ratio is calculated as:
EBIT/ Interest payments
Here, EBIT = EBITDA- Depreciation and amortization expenses.
Continuing the above example,
EBITDA = INR 265 crore
Depreciation expenses = INR 5 crore
EBIT = INR 260 crore
The finance costs of the company = INR 10 crore
So, the Interest coverage ratio = 260/10 = 26 times
This shows that the company has 26 times more earnings than its interest obligations. Hence, the company is in excellent financial health.
Financial Leverage Ratio:
Just like the Debt to asset ratio tells us about how much of the assets are financed through the debt, the financial leverage ratio tells us about how much of the assets are supported through equity capital.
This ratio is calculated as: Financial leverage ratio= Total average assets/ Average total equity
Operating ratios
The operating ratios measure a company’s management efficiency to convert its assets into revenues.
The assets include both current as well as non-current assets. These ratios are also known as activity ratios or management ratios.
The most popular operating ratios are:
Working Capital Turnover Ratio:
The Working capital refers to the amount a company needs to run its day to day operations.
Working capital = Current assets – current liabilities
A positive working capital figure shows that the company is efficient and can easily manage its day to day operations. A working capital deficit is usually financed through debts.
The working capital turnover ratio calculates how much revenues a company generates for per unit of working capital it invests. The higher the ratio, the better the company’s management is.
The working capital turnover ratio is calculated as: Revenue/ Average working capital
The working capital turnover ratio can be understood as,
Suppose the ratio is 5; this means, if a company has working capital of INR 1, it will generate sales of INR 5.
Inventory Turnover Ratio:
This ratio tells the analyst how many times in a given period, a company replenishes its inventory.
For a company that sells fast-moving goods, the inventory turnover would be high, compared to others. The inventory turnover ratio also varies from industry to industry.
To understand this, we can compare a car manufacturer with a milk producer. The car manufacturer sells expensive products, and hence, they take time to sell.
On the other hand, the milk producer has to replenish its stock every day.
The inventory turnover ratio is calculated as: Cost of goods sold / Average inventory
Here, COGS indicates the total Cost incurred for producing the final product. It is calculated as:
COGS = Cost of materials consumed + Power and fuel + Purchases + Any other production -related expense
Suppose the inventory turnover ratio comes out to be 5, this means, in a period of one year, the company has to replenish its inventory 5 times, that is, after 2.4 months.
Inventory Number of Days:
The inventory number of days ratio helps an investor understand how much time it takes for a company to convert its inventories to revenues.
A smaller ratio indicates that the company’s products are fast-moving and in demand. This is considered a green flag for investing.
The inventory number of days is calculated as: 365/ Inventory turnover ratio
However, these figures can give wrong conclusions if they are not double-checked with the company’s production capacity data.
Receivables Turnover Ratio:
The accounts receivables turnover ratio indicates how many times in a given period does the company receives cash from its debtors and customers.
A higher ratio indicates that the company collects cash frequently. This reduces the chances of bad debts, and hence, is a good sign.
The accounts receivables turnover ratio is calculated as: Revenue/ Average receivables
Here, the average receivables are calculated as: (Trade receivables at the beginning of FY+ trade receivables in the end)/2
For example,
Suppose operating revenue for the FY 19-20 = INR 10 crore
Trade receivables, in the beginning, = INR 2 crore
Trade receivables, in the end, = INR 3 crore
Thus, average trade receivables = INR 2.5 Crore
Receivables turnover ratio = 10/2.5 = 4 times
Fixed Assets Turnover Ratio:
This ratio calculates the relationship between the amount invested in fixed assets like land, plant, machinery, and the revenues generated. It measures the company’s efficiency in utilizing its fixed assets.
The higher the ratio, the better it is. This ratio is more often used for measuring the performance of companies in capital intensive industries.
This ratio is calculated as: Fixed assets turnover ratio = Operating revenues / Total average assets
Here, while calculating total average assets, they are taken at a value net of depreciation. The work in progress figures is also taken, as mentioned in the balance sheet of the company.
Total Assets Turnover Ratio:
This ratio calculates the efficiency of the total assets deployed in generating revenue. For the calculation of this ratio, both current and non-current assets are taken into consideration.
Total assets turnover ratio = Operating revenue / Average total assets
In order to understand a company’s performance better, the investor should compare the ratio with different companies in the same sector.
This would help him develop a better insight into the company’s overall performance.
Days’ sales outstanding:
This ratio depicts the time gap between a sale and collection. The faster the company collects its cash from the creditors, the better is the efficiency.
The company can then utilize this cash in its other departments.
The days’ sales outstanding ratio is calculated as: 365 / Accounts receivable turnover ratio
In the above example,
The receivable turnover ratio =4
Days sales outstanding = 365/4 = 91.25
This shows that, if a company raises its invoice today, it will have to wait for a period of 92 days approximately, for the payments to come in.
Conclusion: Financial Ratio Analysis
The financial ratios, be it of any category, cannot be solely used for decision-making purposes. In order to make a better investment, it is essential to compare these ratios with companies in a similar industry.
Also, trends need to be observed in the pattern. While observing the trend, the investor must keep in mind if any significant economic downturn happened in that particular year.
Overall, the financial ratios can help an investor interpret and analyze a company’s financial statements in a better way.
Open a Demat Account in 10 Min & Start Trading Now!
Most Read Articles