How to measure Portfolio Performance? – Tools, Process, Formulas & more
Last Updated Date: Nov 17, 2022The best practice in trading is to measure the returns obtained from the investments frequently. Let’s discuss more on how to measure portfolio performance and return in this article.
A right method, access to the right tools, and a strategic approach can lead to a well-informed and profitable decision.
Suppose you are thinking about how to make huge income and stay profitable. It all starts from the building a strong base of a portfolio.
However, it’s impossible to predict the ever-changing movements of your portfolio.
In which direction it’ll go, it often remains a tricky-to-define point. Still, if you put varying metrics into practice, you can get an idea for how long your money will go.
Even though you’ve built a robust portfolio, still you’ll have to actively consider all those measures that can raise or drop the performance of the portfolio.
How to measure Portfolio Performance?
It’s an ever-lasting notion that portfolio constantly deriving higher returns will do well for a long time. Though, we can’t solely rely on the efficacy of a portfolio.
The risk involved with a particular investment can bring a drastic change to the overall portfolio. Still, many investors consider a risky investment a better source of capturing higher return.
However, it’s true with some underlying exceptions.
For a very long time, people are using various methods to quantify and measure the profitability that comes at a certain risk value.
However, these methods don’t provide precise results. For the perfect measure, analyzing both risk and return ratio together becomes equally essential.
But the following method can help you better if you want to measure the performance of your portfolio and returns.
- Treynor Measure
- Sharpe Ratio
- Jensen Measure
Get expert help for PMS Investment – Fill up the form Now!
Treynor Measure – Tool to measure Portfolio Performance
Jack L. Treynor first introduced the Treynor measure. As per this measure, an investor effectively measures the performance of his portfolio, including the risk associated with it.
The major aim of Treynor on building this measure was to figure out a performance measure that can help all traders equally.
As per Treynor, there’re some underlying factors that raise the chances of risk. In general, fluctuations in the stock market, and fluctuations of individual securities can give rise to a heavy risk.
Owing to this, Treynor brought the Security Market Line concept, which became quite famous over time.
For instance, as per this method, a trader can get a clear-cut insight into the relationship between market returns and portfolio returns.
Though, the line’s slop of the portfolio gives the trader an idea on the volatility between market and portfolio.
Besides, the balance between both risk and return can be measured if the line’s slope is high. Here, the volatility is denoted as a Beta.
Treynor Measure includes:
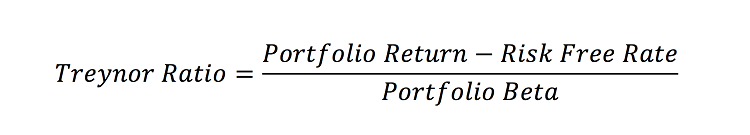
Treynor Measure = (PR – RFR)/ β
Where:
PR = portfolio return
RFR = risk-free rate
β = beta
This method only uses systematic risk. That’s why you should choose this method solely on a well-diversified portfolio.
It doesn’t take unsystematic risk into account. Hence, it becomes an ideal option for a diversified portfolio.
Sharpe Ratio – Tools to measure Portfolio Return
Sharpe Ratio and Teynor Measure are quite alike with a slight distinction. The Sharp Ratio Method includes the risk that measures the portfolio’s standard deviation.
It doesn’t take the systematic risk into account that makes it different from Treynor measure. Bill Sharpe introduced the method.
The whole method measures the capital asset pricing model, total risk and capital market line.
The method is defined as:
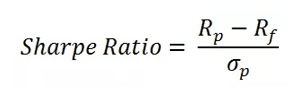
Sharpe ratio= (Rp − Rf) / SD
where:
Rp = Portfolio Return
Rf = Risk-Free Rate
SD = Standard deviation
Sharpe Ration method is quite a better option than Treynor Measure for the reason that it measures both diversification and rate of return.
That’s why, as an investor, if you love to keep your portfolio well-diversified, you should, of course, go with this method. It can correctly measure your portfolio’s performance.
Jensen Measure – Technique to measure Portfolio Performance
Jensen Measure is quite similar to the previous method- the Sharpe Ratio. As per this method, the calculation is done using CAPM.
Though, the method has been named on the real name of its creator- the Michael C. Jensen.
The Jensen measure provides you with the data on excess return. If the generated return value exceeds the expected return, investors choose this method.
The measure of return represents alpha. As per the Jensen Ratio Measure, an investor gets an idea on the ability of return.
What percentage of a portfolio’s return can be referred to as above-average returns at an adjusted risk level; this measure defines it all.
However, better risk-adjusted returns only come to light on a higher ratio. For instance, if there’s a positive excess return, the alpha will also be positive.
On the other hand, if there’s a negative excess return, the alpha will be negative.
The method is defined as:
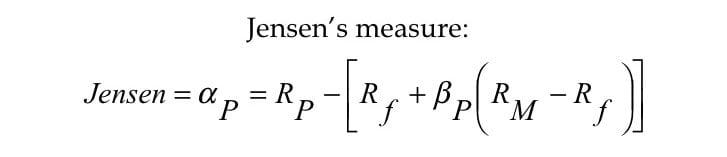
Jenson’s Alpha = Rp − CAPM
where:
PR=Portfolio Return
CAPM=Rf + β (Rm – Rf)
Rf = Risk-Free Return
β = Beta
Rm = Return on the Market
The risk associated with securities and return can vary over time. While calculation, the Jensen measure consider using the rate of return with zero-risk.
How to Calculate the Portfolio’s Investment Return?
As we all know, investment isn’t safe. Probably, it can be a shortcut for creating massive wealth within a short time. Still, it comes at a higher risk.
The notable reasons lie in the uncertainties that any time makes it hard to predict, whether an investor will earn a profit or loss.
Economy, inflation, and various accidental factors make it hard for one to decide anything with confidence.
That’s why you should first gather the entire data and figure out all the basic things to calculate returns.
Before we start calculating Holding Period Return, determine the time period first for which you want to calculate returns.
Be it annually, monthly, quarterly, weekly or daily; set a period and proceed with calculation.
You’ll also be required to set a NAV (Net Asset Value) of every asset position present in a portfolio.
Holding Period Return Formula to Calculate Portfolio Performance
Once you’re ready with the needed data, you can proceed with the calculation. Let’s have a look at the simplest method Holding Period Return for calculating the basic return.
HPR = Income + (End of Period Value – Initial Value) ÷ Initial Value
If you want to hold the investment for a long time, this method will help you in comparing the returns. The method provides you with an idea of how long you should hold an investment.
How to Calculate expected Portfolio Return?
A smart investor never forgets to take a glimpse of the expected return from the particular investment.
Though, it isn’t a prediction, as the derived data isn’t confidential. The obtained data focuses solely on historical returns. Hence, it generates expectations.
But before you start calculating expected return, it’s essential first to figure out the expected return from each asset in a portfolio.
Also, don’t forget to check out the weight of each asset class available in a portfolio. It implies that an investor will keep adding up the weighted average of every asset class.
The method isn’t entirely reliable. It only put the figures in words which have been obtained for a long time from a particular investment.
Thus a trader is also going to expect the same return near in future. Hence, it isn’t confidential data but expectancy-value only.
Expected Return Formula to measure Portfolio Performance
Let’s have a look at the formula to know how to calculate expected return. In the formula, we’re using three securities that are as follows-
Expected Return=WA×RA+WB×RB+WC×RC
where:
RA = Expected return of security A
WA = Weight of security A
WB = Weight of security B
RB = Expected return of security B
RC = Expected return of security C
WC = Weight of security C
Limitation of Expected Return
If you want to be a well-informed investor, you should know about the limitation of the expected return. The market is volatile. Hence, guess-work doesn’t make the right sense.
In this way, you may end up losing your entire money. The data can prove to be in-exact, even though the asset holds a strong track record of the higher rate of return.
As said, expected return only considers historical data without taking the market volatility into account. A range of political, legal, climate, and other elements impact the return value.
Hence, it’s also possible that the expected return value may increase over time. That’s why you must be all-set with your risk tolerance abilities.
How to measure Portfolio Performance? – Conclusion
Measuring portfolio performance is a critical thing to consider. Before the expected return value turns into a big loss on your portfolio, pay attention to what’s essential.
You can take help from the above-stated formulas to conclude the performance of your portfolio, or else, if you want to get an idea about the expected returns.
Don’t forget to take a glimpse of the formula stated above. Though the expected return values aren’t reliable, still you can take it as a target for you so you can achieve at least utmost out of it.
Also, you can get an idea on for how long you should keep investing and hold a particular asset through the Holding Period return formula.
Get expert help for PMS Investment – Fill up the form Now!
Most Read Articles