SMA Indicator
Last Updated Date: Aug 10, 2022Moving average indicators are one of the favorites of technical analysts and traders in the stock market. The indicator comes in different versions to deal with different levels of analysis and stock market predictions.
The first and the most simple version of the moving average indicator is Simple Moving Average (SMA).
This article will help you understand SMA and how it works, how you can use the indicator for stock market analysis, and other different aspects of the indicator.
Stock Analysis using SMA Indicators
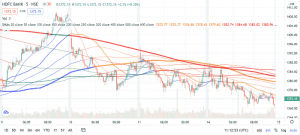
Analyze stocks using our SMA Indicator tools –
What is SMA indicator?
A simple Moving Average which is usually called a moving average or (MA) is derived by summing up the prices of a stock or other asset over a specified period of time and then dividing the sum by the specified period.
 If you are wondering why then it is known as ‘moving average’ the reason is the averages are then plotted over a graph which provides a trail of average prices for a specified period and is thus termed as moving averages.
This is the easiest way to derive a moving average and is thus known as a Simple moving average as there are no weights or other factors used to derive the moving averages of the stocks.
This is a plain and simple moving average that you learned in school.
So, the SMA indicator is nothing but a technical analysis tool that helps you find out the price trend by plotting the moving averages over a price graph. We will discuss how you can read these indicators in the sections below.
Understanding & Calculation of SMA
So, the calculation of SMA remains the same that is –
SMA = (P1+P2+P3+…….+Pn)/n
Here,
P1 = Closing price of day 1 of the period chosen
P2 = closing price of day 2 of the period chosen
Similarly, you take the closing prices for all the days in the specified period.
n= the number of days in that period range
Let’s, take an example to understand this better. Suppose you are tracking Stock A. The closing price of the stock for the last five days is as follows –
P1= Rs. 151
P2 = Rs. 154
P3= Rs. 153
P4= Rs. 157
P5 = Rs. 150
So, SMA for this will be = (151+154+153+157+150)/5 = Rs. 153
This will the first point on the graph. To derive a moving average, the next average would be calculated using the price of day 6 and excluding day 1’s price. The 3rd point will include from Day 3 to Day 7 and so forth.
So, this way you will get five points on the graph and you will be able to understand the price trend by comparing the moving average and the price over a single chart.
Trading Strategies using SMA
Moving averages are calculated for different periods. The most used SMA is for 10 days, 50 days, and 200 days. While the 200-day SMA is for long-term trading purposes, the 10-day and 50-day SMAs are used by short-term traders.
Even the intraday traders make use of SMA, they use the shorter period SMAs and there are even moving averages plotted for hours and days of a week.
So, to formulate the strategy using a simple moving average, you need to first figure out the period for which you want the moving average.
Here are certain ways, you can use the SMA for your trading analysis –
- As you know moving averages are mainly used for predicting the price trend in the market for any asset or overall market, so, by looking at the SMA line, you can understand the trend. Suppose, the SMA is going upward, so, there is an untrendy in the market (most probably) while a declining SMA indicates a downtrend possibly.
- When the price crosses the SMA, it indicates either buys or sell signals. When the price cross SMA and move up, then you can go ‘long’ as the asset will rise in price or the overall market will go up. Similarly, if the price cuts SMA below then it’s time to go ‘short’ or exit the share market.
SMA Crossover
There is another way to use SMA and that is their crossover. So, when an SMA crosses another SMA, it is known as SMA crossover.
When a short-term SMA crosses a long-term SMA and moves up, it indicates a price rise or uptrend and then you can go ‘long’.
While the short-term SMA crosses the long-term SMA and moves below, it indicates a downtrend or asset price to go down, so time to go ‘short’ or exit the market.
You can use any MA of two different time frames for instance one of the 20-days and another one of 50-days if you are predicting for short-term investment. While long-term traders can make use of long-period MAs like 100-day MAs and 200-day MAs.
Benefits and limitations of SMA indicator
Moving average is an integral part of technical analysis and plays an immensely important role for stock market traders. Simple moving average (SMA) is the most used technical indicator because of multiple reasons –
- It is the easiest technical indicator to use. It is a great indicator to use by beginners in the stock market.
- It is suitable for both short-term and long-term traders while long-term traders can benefit more from it as it provides better results in long-term format.
- It helps in the identification of price trends for different assets from stocks, to commodities and currencies as well. You can also use the indicator to understand the overall market trend.
- The indicator is ideal for analyzing daily and weekly technical charts.
While SMA is one of the top technical indicators, however, SMA reacts very slowly to rapid changes in the price of the asset. This in turn makes it incompetent for intraday traders or traders trying to predict market movements for an hour, or the shortest time frame.
Conclusion
To sum it up, SMA is one of the easy-to-use technical indicators to understand the overall market condition and trends.
It can be used by all types of traders and is mainly suitable for beginners who are trying to understand the market and have limited knowledge of the technical tools and indicators.